MONTREAL, Dec. 18, 2024 (GLOBE NEWSWIRE) -- Cerro de Pasco Resources Inc. (CSE: CDPR) (OTCQB: GPPRF) (FRA: N8HP) (“CDPR” or the “Company”) is pleased to report assay results for an additional seven drill holes from the Quiulacocha Tailings Project in Central Peru.
Highlights - All intersections are in core lengths from surface and correspond to the predominant silver-zinc-lead zone in the northern section of the deposit:
- Hole SPT15 intersected 19 meters (“m”) of 73.09 grams per tonne (“g/t”) silver (“Ag”), 2.10% Zinc (“Zn”), 0.90% Lead (“Pb”), and 27.30 g/t gallium (“Ga”)
- Hole SPT16 intersected 19 m of 55.44 g/t Ag, 1.64% Zn, 0.70% Pb, and 26.21 g/t Ga
- Hole SPT17 intersected 21 m of 54.71 g/t Ag, 1.50% Zn, 0.70% Pb, and 31.05 g/t Ga
- Hole SPT18 intersected 22 m of 50.27 g/t Ag, 1.31% Zn, 0.65% Pb, and 28.99 g/t Ga
- Hole SPT34 intersected 15 m of 58.77 g/t Ag, 1.79% Zn, 0.70% Pb, and 31.29 g/t Ga
- Hole SPT37 intersected 18 m at 50.51 g/t Ag, 1.28% Zn, 0.89% Pb, and 49.26 g/t Ga
- Hole SPT38 intersected 18 m at 50.38 g/t Ag, 1.48% Zn, 0.96% Pb, and 55.68 g/t Ga.
"Today’s drillhole results are highly encouraging and exceed our initial projections, particularly regarding silver continuity and grade,” stated Guy Goulet, CEO. “In addition to silver, zinc, lead, copper, and gold, the consistent presence of gallium exceeds expectations and provides a potentially significant upside to the project's economics. With China’s recent move to ban exports of this rare metal to the US, gallium prices have soared, with its significance now emerging for many. Representative composite samples will now undergo metallurgical testing to support future studies. These findings will inform our planning for an extended drilling campaign.”
The results demonstrate that the metal content is continuous at depth and laterally across 400 meters of the drilled area (Figure 1). The assay results for each of the seven drill holes are presented in Tables 1 to 7.
The Iron results also indicate a consistent presence of pyrite throughout the deposit. Pyrite (indicatively 50% of the tailings) may represent a valuable by-product for the project. The upcoming metallurgical test work program will also evaluate the potential for pyrite recovery, including estimated grade, by-products and impurities.
Figure 1: 40-hole Quiulacocha Drill Program showing drillholes related to this press release
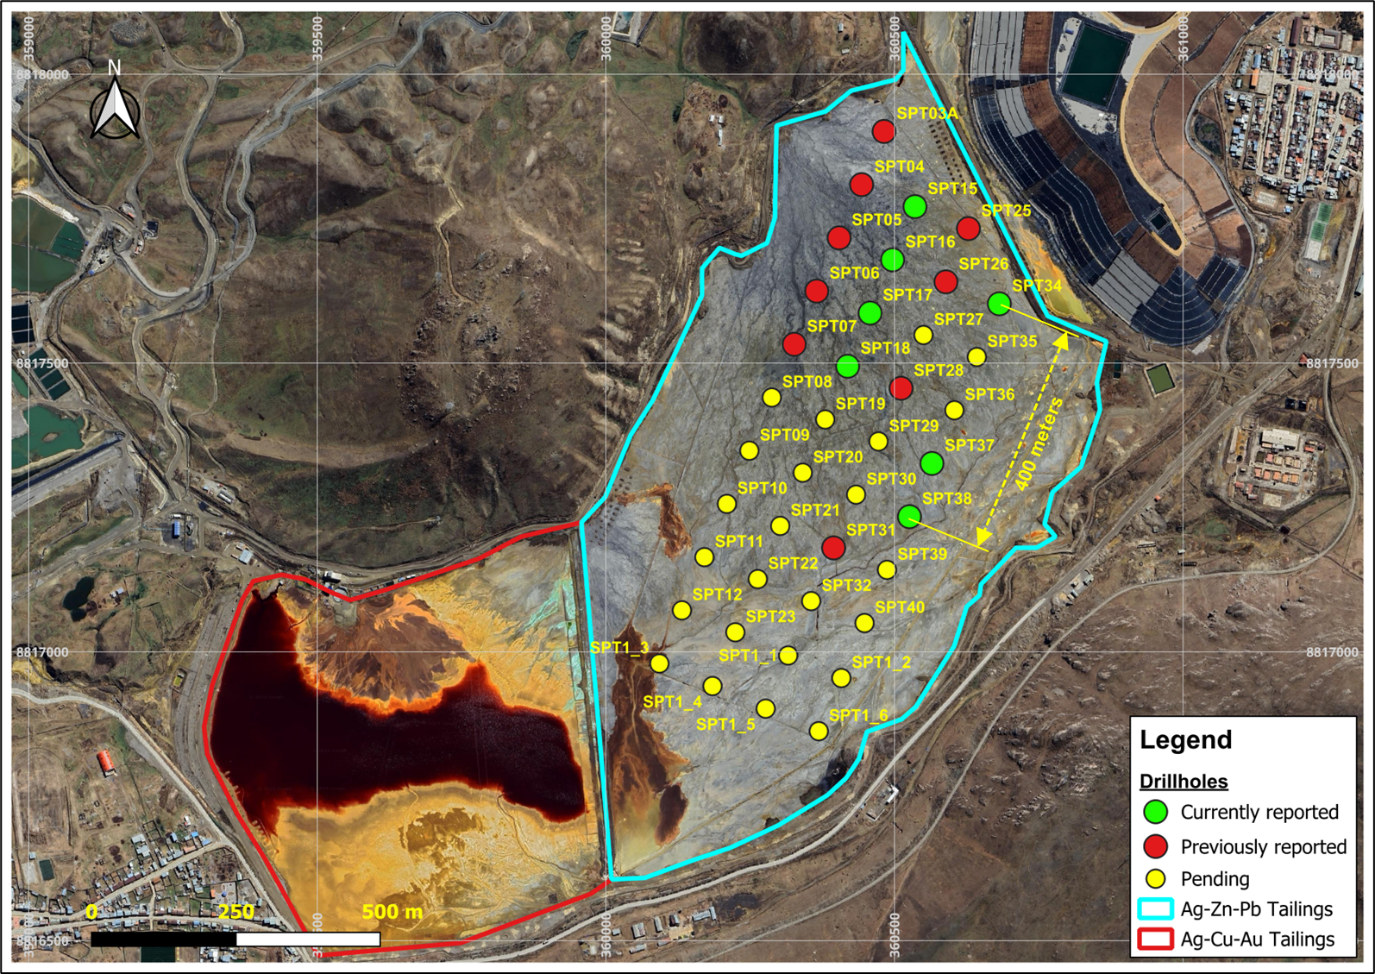
Table 1. Assay results, Drillhole SPT15
| Drillhole: SPT15 | ||||||||||
| From | To | Ag (oz/t) | Ag (g/t) | % Zn | % Pb | % Cu | Au (g/t) | Ga (g/t) | In (g/t) | % Fe |
| 0 | 1 | 2.11 | 65.55 | 1.01 | 0.71 | 0.09 | 0.07 | 59.76 | 39.56 | 27.98 |
| 1 | 2 | 1.88 | 58.44 | 1.13 | 0.62 | 0.09 | 0.06 | 53.60 | 50.88 | 33.56 |
| 2 | 3 | 1.44 | 44.79 | 1.25 | 0.49 | 0.03 | 0.03 | 33.60 | 19.48 | 32.87 |
| 3 | 4 | 2.04 | 63.46 | 2.22 | 0.72 | 0.04 | 0.03 | 19.80 | 22.05 | 32.45 |
| 4 | 5 | 4.65 | 144.72 | 3.76 | 2.22 | 0.06 | 0.04 | 20.76 | 24.00 | 35.22 |
| 5 | 6 | 4.72 | 146.74 | 4.81 | 2.44 | 0.06 | 0.03 | 17.52 | 24.80 | 29.81 |
| 6 | 7 | 2.98 | 92.74 | 3.05 | 1.05 | 0.06 | 0.03 | 20.88 | 24.97 | 34.20 |
| 7 | 8 | 2.12 | 66.05 | 2.60 | 0.77 | 0.05 | 0.03 | 17.86 | 20.29 | 34.40 |
| 8 | 9 | 1.94 | 60.31 | 2.17 | 0.63 | 0.06 | 0.04 | 16.34 | 16.57 | 36.22 |
| 9 | 10 | 2.06 | 64.22 | 2.31 | 0.70 | 0.07 | 0.04 | 14.46 | 17.40 | 37.71 |
| 10 | 11 | 1.74 | 54.18 | 1.75 | 0.59 | 0.06 | 0.04 | 16.92 | 14.92 | 35.75 |
| 11 | 12 | 1.77 | 54.98 | 1.60 | 0.57 | 0.06 | 0.05 | 19.65 | 15.80 | 35.45 |
| 12 | 13 | 1.68 | 52.21 | 1.25 | 0.58 | 0.07 | 0.08 | 18.20 | 14.14 | 36.09 |
| 13 | 14 | 1.87 | 58.25 | 1.91 | 1.62 | 0.12 | 0.10 | 77.56 | 20.60 | 32.52 |
| 14 | 15 | 1.67 | 52.09 | 1.72 | 0.79 | 0.15 | 0.23 | 26.00 | 16.82 | 32.97 |
| 15 | 16 | 1.72 | 53.42 | 2.05 | 0.70 | 0.23 | 0.36 | 19.01 | 16.91 | 32.21 |
| 16 | 17 | 1.76 | 54.79 | 2.15 | 0.65 | 0.23 | 0.35 | 17.76 | 18.97 | 32.30 |
| 17 | 18 | 1.96 | 60.84 | 2.08 | 0.56 | 0.29 | 0.47 | 18.92 | 19.95 | 32.21 |
| 18 | 19 | 4.53 | 140.90 | 1.17 | 0.71 | 0.45 | 0.21 | 30.12 | 17.26 | 39.29 |
| Mean | 2.35 | 73.09 | 2.10 | 0.90 | 0.12 | 0.12 | 27.30 | 21.86 | 33.85 | |
Table 2. Assay results, Drillhole SPT16
| Drillhole: SPT16 | ||||||||||
| From | To | Ag (oz/t) | Ag (g/t) | % Zn | % Pb | % Cu | Au (g/t) | Ga (g/t) | In (g/t) | % Fe |
| 0 | 1 | 2.79 | 86.91 | 0.86 | 0.85 | 0.03 | 0.05 | 42.32 | 19.00 | 32.77 |
| 1 | 2 | 2.41 | 74.90 | 0.92 | 0.70 | 0.03 | 0.05 | 33.16 | 20.49 | 31.85 |
| 2 | 3 | 1.33 | 41.42 | 1.05 | 0.48 | 0.03 | 0.03 | 39.20 | 21.17 | 31.82 |
| 3 | 4 | 1.28 | 39.90 | 1.05 | 0.48 | 0.03 | 0.03 | 22.80 | 20.91 | 31.38 |
| 4 | 5 | 1.39 | 43.09 | 1.15 | 0.49 | 0.03 | 0.03 | 29.52 | 20.59 | 33.62 |
| 5 | 6 | 1.91 | 59.32 | 1.95 | 0.67 | 0.04 | 0.03 | 18.24 | 12.96 | 31.65 |
| 6 | 7 | 2.15 | 66.84 | 2.38 | 0.78 | 0.05 | 0.04 | 16.08 | 13.48 | 35.89 |
| 7 | 8 | 2.02 | 62.85 | 3.17 | 0.74 | 0.04 | 0.04 | 18.13 | 22.05 | 37.85 |
| 8 | 9 | 2.00 | 62.36 | 2.57 | 0.73 | 0.05 | 0.03 | 19.61 | 20.21 | 33.91 |
| 9 | 10 | 2.05 | 63.88 | 2.34 | 0.63 | 0.05 | 0.03 | 18.99 | 18.74 | 29.24 |
| 10 | 11 | 1.46 | 45.30 | 1.45 | 0.75 | 0.07 | 0.03 | 20.32 | 18.07 | 31.61 |
| 11 | 12 | 1.55 | 48.18 | 1.31 | 0.80 | 0.08 | 0.03 | 32.48 | 18.12 | 28.99 |
| 12 | 13 | 1.65 | 51.19 | 1.56 | 0.76 | 0.08 | 0.07 | 14.68 | 18.58 | 32.88 |
| 13 | 14 | 1.57 | 48.91 | 1.36 | 0.92 | 0.09 | 0.07 | 30.84 | 21.32 | 31.25 |
| 14 | 15 | 1.53 | 47.61 | 1.26 | 0.86 | 0.09 | 0.08 | 40.08 | 21.20 | 29.59 |
| 15 | 16 | 1.58 | 49.02 | 1.65 | 0.78 | 0.13 | 0.16 | 27.84 | 21.07 | 31.43 |
| 16 | 17 | 1.74 | 54.11 | 1.81 | 0.73 | 0.20 | 0.19 | 27.04 | 21.92 | 32.77 |
| 17 | 18 | 1.83 | 56.89 | 1.87 | 0.60 | 0.23 | 0.27 | 25.52 | 17.05 | 31.05 |
| 18 | 19 | 1.63 | 50.62 | 1.41 | 0.46 | 0.24 | 0.43 | 21.20 | 15.59 | 29.14 |
| Mean | 1.78 | 55.44 | 1.64 | 0.70 | 0.08 | 0.09 | 26.21 | 19.08 | 32.04 | |
Table 3. Assay results, Drillhole SPT17
| Drillhole: SPT17 | ||||||||||
| From | To | Ag (oz/t) | Ag (g/t) | % Zn | % Pb | % Cu | Au (g/t) | Ga (g/t) | In (g/t) | % Fe |
| 0 | 1 | 1.68 | 52.40 | 0.66 | 0.83 | 0.04 | 0.05 | 59.51 | 19.24 | 24.82 |
| 1 | 2 | 1.44 | 44.80 | 1.02 | 0.66 | 0.03 | 0.04 | 42.67 | 18.80 | 26.25 |
| 2 | 3 | 1.53 | 47.56 | 1.10 | 0.54 | 0.02 | 0.03 | 43.34 | 23.17 | 28.67 |
| 3 | 4 | 1.56 | 48.44 | 1.11 | 0.55 | 0.02 | 0.03 | 38.01 | 20.88 | 29.03 |
| 4 | 5 | 1.51 | 46.88 | 1.00 | 0.43 | 0.02 | 0.03 | 25.56 | 15.35 | 34.77 |
| 5 | 6 | 2.28 | 70.99 | 2.13 | 0.68 | 0.05 | 0.03 | 27.52 | 21.45 | 32.89 |
| 6 | 7 | 1.98 | 61.52 | 1.91 | 0.61 | 0.04 | 0.03 | 21.96 | 19.52 | 34.53 |
| 7 | 8 | 2.12 | 65.90 | 2.25 | 0.64 | 0.05 | 0.04 | 16.12 | 20.98 | 34.80 |
| 8 | 9 | 1.97 | 61.33 | 1.82 | 0.64 | 0.06 | 0.03 | 30.68 | 17.38 | 32.67 |
| 9 | 10 | 1.90 | 59.17 | 1.57 | 0.63 | 0.06 | 0.03 | 29.60 | 16.23 | 29.74 |
| 10 | 11 | 2.34 | 72.93 | 1.80 | 0.63 | 0.07 | 0.03 | 26.40 | 19.80 | 32.90 |
| 11 | 12 | 1.70 | 52.82 | 1.28 | 0.77 | 0.07 | 0.03 | 36.20 | 16.34 | 29.62 |
| 12 | 13 | 1.64 | 50.88 | 1.59 | 0.94 | 0.11 | 0.09 | 33.92 | 18.63 | 31.78 |
| 13 | 14 | 1.70 | 52.93 | 1.31 | 1.07 | 0.08 | 0.06 | 38.92 | 18.37 | 31.94 |
| 14 | 15 | 1.79 | 55.63 | 1.33 | 1.06 | 0.09 | 0.06 | 38.68 | 17.85 | 32.40 |
| 15 | 16 | 1.69 | 52.63 | 1.36 | 0.82 | 0.11 | 0.11 | 34.08 | 17.10 | 32.58 |
| 16 | 17 | 1.57 | 48.79 | 1.42 | 0.87 | 0.09 | 0.08 | 32.36 | 17.52 | 32.48 |
| 17 | 18 | 1.48 | 45.93 | 1.55 | 0.65 | 0.13 | 0.17 | 23.04 | 15.66 | 29.13 |
| 18 | 19 | 1.65 | 51.22 | 1.67 | 0.54 | 0.21 | 0.31 | 18.64 | 16.12 | 29.31 |
| 19 | 20 | 1.69 | 52.63 | 1.82 | 0.58 | 0.21 | 0.29 | 17.08 | 16.62 | 32.14 |
| 20 | 21 | 1.72 | 53.65 | 1.75 | 0.59 | 0.18 | 0.26 | 17.67 | 15.19 | 32.91 |
| Mean | 1.76 | 54.71 | 1.50 | 0.70 | 0.08 | 0.09 | 31.05 | 18.20 | 31.21 | |
Table 4. Assay results, Drillhole SPT18
| Drillhole: SPT18 | ||||||||||
| From | To | Ag (oz/t) | Ag (g/t) | % Zn | % Pb | % Cu | Au (g/t) | Ga (g/t) | In (g/t) | % Fe |
| 0 | 1 | 1.78 | 55.48 | 0.49 | 0.97 | 0.06 | 0.05 | 56.41 | 25.37 | 24.11 |
| 1 | 2 | 1.38 | 43.04 | 1.23 | 0.69 | 0.03 | 0.04 | 33.47 | 8.12 | 25.69 |
| 2 | 3 | 1.51 | 46.88 | 0.90 | 0.57 | 0.03 | 0.04 | 36.46 | 18.77 | 27.38 |
| 3 | 4 | 1.42 | 44.20 | 0.97 | 0.49 | 0.03 | 0.03 | 26.12 | 19.45 | 27.47 |
| 4 | 5 | 1.59 | 49.36 | 0.99 | 0.43 | 0.03 | 0.03 | 22.26 | 16.92 | 29.00 |
| 5 | 6 | 1.67 | 51.80 | 1.06 | 0.49 | 0.03 | 0.03 | 24.57 | 16.52 | 32.89 |
| 6 | 7 | 1.67 | 51.80 | 1.01 | 0.46 | 0.03 | 0.03 | 13.31 | 16.40 | 33.00 |
| 7 | 8 | 1.75 | 54.36 | 1.09 | 0.52 | 0.04 | 0.03 | 18.77 | 17.00 | 29.46 |
| 8 | 9 | 1.89 | 58.68 | 1.16 | 0.52 | 0.04 | 0.03 | 26.46 | 16.84 | 29.24 |
| 9 | 10 | 1.80 | 55.92 | 1.38 | 0.61 | 0.05 | 0.03 | 26.80 | 18.59 | 28.86 |
| 10 | 11 | 1.77 | 55.12 | 1.36 | 0.64 | 0.05 | 0.03 | 26.00 | 17.30 | 27.85 |
| 11 | 12 | 1.73 | 53.76 | 1.29 | 0.69 | 0.06 | 0.03 | 29.61 | 18.37 | 27.47 |
| 12 | 13 | 1.64 | 51.12 | 1.25 | 0.58 | 0.05 | 0.03 | 29.06 | 16.50 | 25.40 |
| 13 | 14 | 1.82 | 56.56 | 1.51 | 1.46 | 0.09 | 0.06 | 52.96 | 6.08 | 26.74 |
| 14 | 15 | 1.61 | 50.08 | 1.49 | 0.95 | 0.07 | 0.06 | 40.19 | 20.92 | 26.35 |
| 15 | 16 | 1.54 | 47.88 | 1.25 | 0.82 | 0.07 | 0.07 | 35.53 | 16.91 | 29.24 |
| 16 | 17 | 1.48 | 45.92 | 1.50 | 0.79 | 0.10 | 0.11 | 27.47 | 20.32 | 28.26 |
| 17 | 18 | 1.28 | 39.92 | 1.43 | 0.59 | 0.13 | 0.14 | 22.01 | 17.35 | 26.22 |
| 18 | 19 | 1.44 | 44.72 | 1.60 | 0.64 | 0.12 | 0.11 | 23.31 | 17.88 | 27.39 |
| 19 | 20 | 1.53 | 47.64 | 1.90 | 0.51 | 0.21 | 0.28 | 24.32 | 18.86 | 25.26 |
| 20 | 21 | 1.58 | 49.08 | 1.71 | 0.48 | 0.21 | 0.37 | 21.42 | 17.24 | 26.71 |
| 21 | 22 | 1.69 | 52.64 | 2.18 | 0.46 | 0.26 | 0.44 | 21.34 | 20.59 | 27.16 |
| Mean | 1.62 | 50.27 | 1.31 | 0.65 | 0.08 | 0.09 | 28.99 | 17.38 | 27.78 | |
Table 5. Assay results, Drillhole SPT34
| Drillhole: SPT34 | ||||||||||
| From | To | Ag (oz/t) | Ag (g/t) | % Zn | % Pb | % Cu | Au (g/t) | Ga (g/t) | In (g/t) | % Fe |
| 0 | 1 | 2.71 | 84.41 | 0.30 | 2.04 | 0.03 | 0.06 | 128.00 | 24.12 | 21.64 |
| 1 | 2 | 1.75 | 54.57 | 0.94 | 0.97 | 0.03 | 0.04 | 63.00 | 21.52 | 27.33 |
| 2 | 3 | 1.32 | 41.10 | 0.93 | 0.58 | 0.02 | 0.03 | 43.47 | 20.40 | 30.46 |
| 3 | 4 | 1.05 | 32.51 | 0.82 | 0.38 | 0.02 | 0.03 | 27.09 | 15.27 | 29.85 |
| 4 | 5 | 2.44 | 75.78 | 3.30 | 0.76 | 0.04 | 0.03 | 15.75 | 17.88 | 31.34 |
| 5 | 6 | 2.31 | 71.90 | 2.80 | 0.59 | 0.04 | 0.02 | 34.42 | 24.52 | 27.87 |
| 6 | 7 | 2.29 | 71.33 | 3.08 | 0.66 | 0.05 | 0.03 | 21.31 | 23.60 | 29.48 |
| 7 | 8 | 2.42 | 75.24 | 2.34 | 0.61 | 0.05 | 0.03 | 17.61 | 23.70 | 33.24 |
| 8 | 9 | 1.94 | 60.31 | 2.20 | 0.57 | 0.05 | 0.04 | 19.22 | 19.51 | 29.45 |
| 9 | 10 | 2.06 | 64.07 | 2.10 | 0.68 | 0.05 | 0.04 | 19.04 | 17.73 | 32.91 |
| 10 | 11 | 1.90 | 59.17 | 1.97 | 0.59 | 0.05 | 0.05 | 13.62 | 18.62 | 32.34 |
| 11 | 12 | 1.90 | 59.01 | 2.10 | 0.59 | 0.05 | 0.04 | 18.87 | 17.44 | 30.97 |
| 12 | 13 | 1.66 | 51.76 | 1.54 | 0.52 | 0.05 | 0.06 | 17.69 | 14.32 | 32.26 |
| 13 | 14 | 1.35 | 42.07 | 1.29 | 0.49 | 0.05 | 0.08 | 15.44 | 13.44 | 32.72 |
| 14 | 15 | 1.23 | 38.38 | 1.16 | 0.50 | 0.06 | 0.09 | 14.82 | 12.42 | 32.30 |
| Mean | 1.89 | 58.77 | 1.79 | 0.70 | 0.04 | 0.04 | 31.29 | 18.97 | 30.28 | |
Table 6. Assay results, Drillhole SPT37
| Drillhole: SPT37 | ||||||||||
| From | To | Ag (oz/t) | Ag (g/t) | % Zn | % Pb | % Cu | Au (g/t) | Ga (g/t) | In (g/t) | % Fe |
| 0 | 1 | 2.10 | 65.28 | 0.32 | 1.19 | 0.03 | 0.06 | 88.75 | 24.67 | 22.97 |
| 1 | 2 | 1.68 | 52.40 | 1.01 | 1.14 | 0.04 | 0.04 | 76.10 | 15.40 | 24.98 |
| 2 | 3 | 1.44 | 44.92 | 0.82 | 0.91 | 0.05 | 0.03 | 85.43 | 21.28 | 25.69 |
| 3 | 4 | 1.24 | 38.56 | 0.87 | 0.58 | 0.03 | 0.03 | 65.39 | 22.64 | 28.13 |
| 4 | 5 | 1.20 | 37.24 | 0.91 | 0.52 | 0.03 | 0.03 | 47.59 | 19.80 | 28.30 |
| 5 | 6 | 1.64 | 51.08 | 1.28 | 0.64 | 0.04 | 0.03 | 43.68 | 21.74 | 28.85 |
| 6 | 7 | 2.14 | 66.68 | 1.78 | 0.73 | 0.06 | 0.03 | 35.83 | 23.99 | 33.40 |
| 7 | 8 | 1.65 | 51.24 | 1.49 | 0.73 | 0.06 | 0.03 | 47.08 | 22.20 | 27.58 |
| 8 | 9 | 1.86 | 57.96 | 1.48 | 0.67 | 0.06 | 0.03 | 46.20 | 22.10 | 28.60 |
| 9 | 10 | 1.75 | 54.44 | 1.60 | 0.61 | 0.05 | 0.03 | 35.95 | 22.21 | 27.56 |
| 10 | 11 | 1.60 | 49.68 | 1.46 | 0.52 | 0.04 | 0.04 | 21.17 | 15.87 | 27.43 |
| 11 | 12 | 1.88 | 58.48 | 1.55 | 1.41 | 0.10 | 0.05 | 55.65 | 18.16 | 29.81 |
| 12 | 13 | 1.69 | 52.56 | 1.30 | 0.87 | 0.07 | 0.06 | 33.85 | 18.31 | 32.67 |
| 13 | 14 | 1.65 | 51.44 | 1.50 | 1.21 | 0.09 | 0.07 | 40.40 | 24.24 | 29.58 |
| 14 | 15 | 1.91 | 59.28 | 1.73 | 1.89 | 0.16 | 0.08 | 73.21 | 24.24 | 28.20 |
| 15 | 16 | 1.47 | 45.72 | 1.66 | 1.17 | 0.10 | 0.08 | 38.35 | 23.38 | 29.19 |
| 16 | 17 | 1.29 | 40.20 | 1.33 | 0.71 | 0.11 | 0.11 | 29.02 | 20.41 | 28.08 |
| 17 | 18 | 1.03 | 31.96 | 1.00 | 0.55 | 0.09 | 0.07 | 23.06 | 15.42 | 23.71 |
| Mean | 1.62 | 50.51 | 1.28 | 0.89 | 0.07 | 0.05 | 49.26 | 20.89 | 28.04 | |
Table 7. Assay results, Drillhole SPT38
| Drillhole: SPT38 | ||||||||||
| From | To | Ag (oz/t) | Ag (g/t) | % Zn | % Pb | % Cu | Au (g/t) | Ga (g/t) | In (g/t) | % Fe |
| 0 | 1 | 2.14 | 66.60 | 0.22 | 2.29 | 0.01 | 0.06 | 128.00 | 24.22 | 13.78 |
| 1 | 2 | 1.73 | 53.92 | 1.05 | 1.52 | 0.05 | 0.04 | 111.00 | 20.00 | 25.10 |
| 2 | 3 | 1.44 | 44.68 | 1.00 | 0.93 | 0.03 | 0.04 | 95.17 | 21.24 | 27.03 |
| 3 | 4 | 1.10 | 34.24 | 0.94 | 0.55 | 0.03 | 0.03 | 61.99 | 24.58 | 28.40 |
| 4 | 5 | 1.03 | 31.96 | 1.08 | 0.69 | 0.04 | 0.03 | 68.59 | 16.96 | 26.14 |
| 5 | 6 | 1.79 | 55.67 | 1.55 | 0.87 | 0.05 | 0.02 | 83.54 | 23.66 | 29.22 |
| 6 | 7 | 1.80 | 55.90 | 1.50 | 0.69 | 0.06 | 0.03 | 50.74 | 20.13 | 29.59 |
| 7 | 8 | 1.79 | 55.74 | 1.50 | 0.66 | 0.06 | 0.03 | 33.52 | 18.14 | 31.56 |
| 8 | 9 | 2.35 | 73.12 | 2.12 | 0.85 | 0.06 | 0.03 | 36.12 | 22.81 | 33.61 |
| 9 | 10 | 1.83 | 57.00 | 1.69 | 0.70 | 0.05 | 0.03 | 37.25 | 18.60 | 32.03 |
| 10 | 11 | 1.63 | 50.80 | 1.33 | 0.83 | 0.06 | 0.04 | 39.14 | 16.77 | 30.42 |
| 11 | 12 | 1.53 | 47.57 | 1.28 | 0.80 | 0.06 | 0.06 | 33.60 | 14.76 | 30.22 |
| 12 | 13 | 1.75 | 54.30 | 1.56 | 1.19 | 0.08 | 0.05 | 40.45 | 20.28 | 30.21 |
| 13 | 14 | 1.87 | 58.10 | 1.97 | 1.62 | 0.11 | 0.07 | 60.10 | 17.96 | 31.12 |
| 14 | 15 | 1.45 | 45.10 | 1.54 | 0.92 | 0.11 | 0.09 | 37.67 | 21.84 | 31.83 |
| 15 | 16 | 1.41 | 43.88 | 1.68 | 0.90 | 0.07 | 0.07 | 33.56 | 16.79 | 32.02 |
| 16 | 17 | 1.40 | 43.55 | 3.12 | 0.75 | 0.08 | 0.09 | 27.68 | 18.49 | 22.21 |
| 17 | 18 | 1.12 | 34.72 | 1.51 | 0.61 | 0.06 | 0.06 | 24.07 | 14.04 | 24.12 |
| Mean | 1.62 | 50.38 | 1.48 | 0.96 | 0.06 | 0.05 | 55.68 | 19.52 | 28.26 | |
Drill Program
CDPR engaged Ingetrol Comercial S.A.C., a subsidiary of Grupo Ingetrol (Chile), and ConeTec Peru, a subsidiary of the ConeTec Group (Canada). The campaign utilizes percussion and sonic drilling techniques to ensure the most accurate results.
On October 23rd, the Company completed the last of 40 drill holes, ahead of the rainy season, collecting more than 1,000 samples over a significant portion of the Quiulacocha tailings deposit. The samples were safely transported to the laboratory in freezer containers and are currently being analyzed.
Laboratory Testing
All samples are stored and transported to Lima in freezer containers to prevent oxidation and preserve sample integrity.
The samples are dried and tested at the Inspectorate Services Lab (Bureau Veritas) in Lima. Following geochemical and mineralogical testing, representative composites from select samples will be sent for an advanced metallurgical test work program.
The assay results are derived from a combination of multi-element ICP (detecting 60 elements), Atomic Absorption (for determining upper limits of the metals Zn, Pb, and Cu), and Fire Assay for Au.
Quality Assurance (QA) and Quality Control (QC)
The preparation of samples for Geochemical Analyses comprises drying at 100°C and riffle splitting to obtain a representative pulp sample of 250 grams. The sample does not undergo sieving or any other mechanical preparation (crushing or grinding) to preserve the original grain size distribution.
Bureau Veritas performs all sample preparation and analytical programs, supported by the QA/QC program, which is monitored on a sample lot basis. The CDPR QA/QC program consists of inserting twin samples, coarse duplicate samples, pulp duplicate samples, standard reference materials, and coarse blank material and further checking at a second laboratory.
Geophysics
CDPR has successfully completed Phase 1 of its geophysical studies, focusing on the dry areas of the Quiulacocha Tailings. Depth readings, conducted by Geomain Ingenieros S.A.C., ranged from 20 to over 40 meters in various locations.
The Quiulacocha Tailings
CDPR is the titleholder of the concession “El Metalurgista” in Peru, which grants it the right to explore and exploit the Quiulacocha Tailings within its assigned area. The General Mining Bureau of the Peruvian Ministry of Energy and Mines has formally confirmed the enforceability of these rights.
The Quiulacocha Tailings Storage Facility covers approximately 115 hectares and is estimated to hold approximately 75 million tonnes of material processed from the 1920s to 1990s.
Initially, these tailings resulted from the mining of 16+ million tonnes of copper-silver-gold mineralization with reported historical grades of up to 10% Cu, 4 g/t Au, and over 300 g/t Ag, and later from the mining of 58+ million tonnes of zinc-lead-silver mineralized material with average historical grades of 7.41% Zn, 2.77% Pb, and 90.33 g/t Ag.
With minimal mining costs due to surface-level material and current reprocessing capacity at adjacent plants, CDPR's Quiulacocha Project stands out as one of Peru's key mining initiatives. This project provides economic benefits and aims to restore the environment and create employment opportunities, aligning with the local community's needs.
Technical Information
Mr. Alfonso Palacio Castilla, MIMMM/Chartered Engineer (CEng) and Project Superintendent for CDPR, has reviewed and approved the scientific and technical information contained in this news release. Mr. Palacio is a Qualified Person for the purposes of reporting in compliance with NI 43-101.
Cerro de Pasco Resources
Cerro de Pasco Resources Inc. is focused on the development of its principal 100% owned asset, the El Metalurgista mining concession, comprising silver-rich mineral tailings and stockpiles extracted over a century of operation from the Cerro de Pasco open pit mine in Central Peru. The company’s approach at El Metalurgista entails the reprocessing and environmental remediation of mining waste and the creation of numerous opportunities in a circular economy. The asset is one of the world’s largest above-ground resources.
Forward-Looking Statements and Disclaimer
Certain information contained herein may constitute “forward-looking information” under Canadian securities legislation. Generally, forward-looking information can be identified using forward-looking terminology such as “plans”, “seeks”, “expects”, “estimates”, “intends”, “anticipates”, “believes”, “could”, “might”, “likely” or variations of such words, or statements that certain actions, events or results “may”, “will”, “could”, “would”, “might”, “will be taken”, “occur”, “be achieved” or other similar expressions.
Forward-looking statements, including the expectations of CDPR’s management regarding the realization, timing and scope of its drilling program, the completion of a resource report as well as the business and the expansion and growth of CDPR’s operations, are based on CDPR’s estimates and are subject to known and unknown risks, uncertainties and other factors that may cause the actual results, level of activity, performance or achievements of CDPR to be materially different from those expressed or implied by such forward-looking statements or forward-looking information.
Forward-looking statements are subject to business and economic factors and uncertainties and other factors, that could cause actual results to differ materially from these forward-looking statements, including the relevant assumptions and risks factors set out in CDPR’s public documents, available on SEDAR+ at www.sedarplus.ca. There can be no assurance that such statements will prove to be accurate, as actual results and future events could differ materially from those anticipated in such statements. Although CDPR believes that the assumptions and factors used in preparing the forward-looking statements are reasonable, undue reliance should not be placed on these statements and forward-looking information. Except where required by applicable law, CDPR disclaims any intention or obligation to update or revise any forward-looking statement, whether as a result of new information, future events or otherwise.
Further Information
Guy Goulet, CEO
Telephone: +1-579-476-7000
Mobile: +1-514-294-7000
ggoulet@pascoresources.com
A photo accompanying this announcement is available at https://www.globenewswire.com/NewsRoom/AttachmentNg/c47a797b-f850-47f5-a9be-abee552d6e2d

![]()


