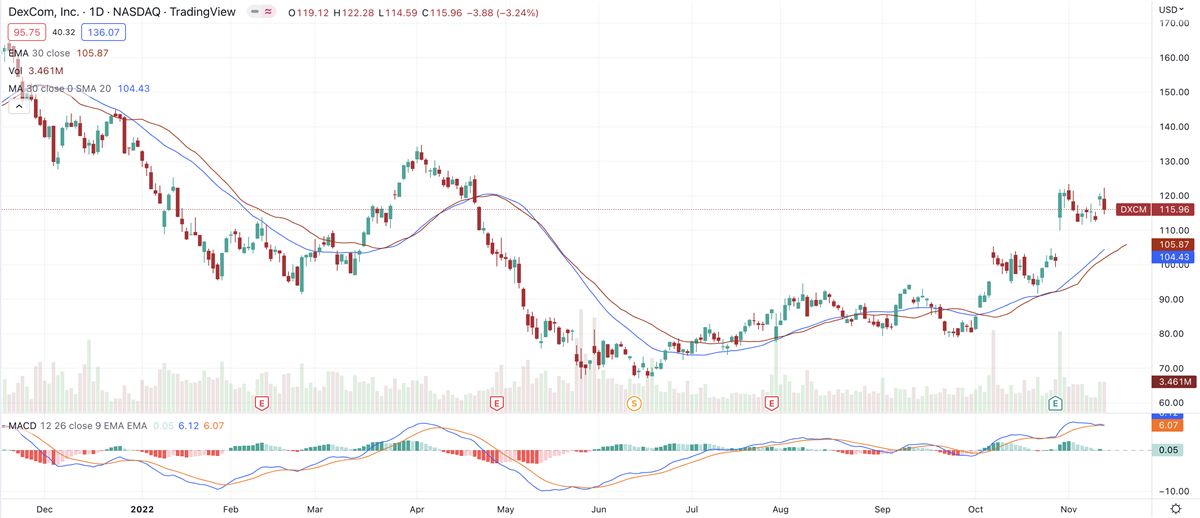
 Medical device maker DexCom (NASDAQ: DXCM) has been trading in a fairly tight range recently, holding gains from the company’s third-quarter report in late October.
 The stock is up 16.33% in the past month. Even before the 19% gap-up following the earnings report, DexCom was already beginning to trend higher.
In the past three months, DexCom has advanced 31.41%. It’s not the top performer within the medical device industry in the past 12 months, however. A large cap with top performance is Abiomed (NASDAQ: ABMD).
Smaller medical gear makers with outstanding price action include TransMedics Group (NASDAQ: TMDX) and Lantheus (NASDAQ: LNTH). Numerous small companies have also posted excellent price performance in the past year, making the entire sub-industry a rising leader within the broader healthcare sector.
Fellow large caps Medtronic (NYSE: MDT), Stryker (NYSE: SYK), Boston Scientific (NYSE: BSX), and Edwards Lifesciences (NYSE: EW) are all underperforming DexCom.
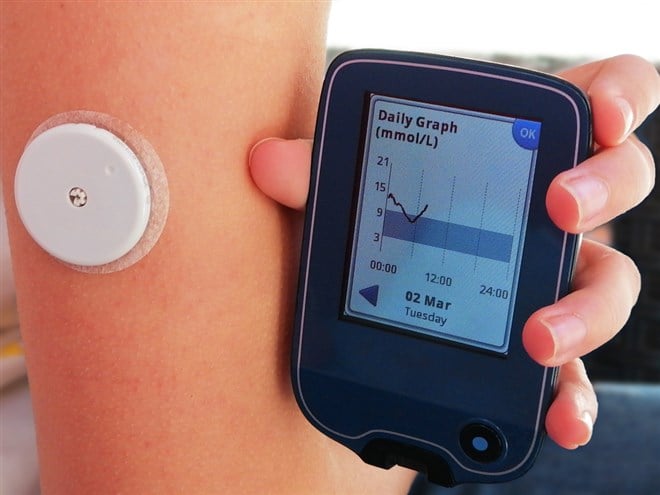
S&P 500 component DexCom makes glucose monitors for diabetes patients. That may sound like an established line of business without much need for innovation, but DexCom is busy creating more opportunities.
In the third quarter, the company earned 0.28 per share on revenue of $770 million. Those were gains of 27% and 18% respectively. DexCom beat views on both the top and bottom lines.
Expanding Its Market
In the quarter, DexCom initiated the international rollout of its new sensor, G7. The product was launched in the United Kingdom, Ireland, Germany, Austria, and Hong Kong. It’s also received inclusion for healthcare reimbursement in several U.K. markets, which will likely help expand market share.
The G7 is a wearable device that helps diabetics track blood-sugar levels.
DexCom is focusing on making its continuous glucose monitors, known as CGMs, available to a bigger group of patients. Medicare and Medicaid rules may change, to allow patients needing one daily dose of insulin to get reimbursement for CGMs. If insurance companies follow the government's lead, and they typically do, that could be a boon for DexCom revenue.
In the third-quarter earnings release, DexCom CEO Kevin Sayer also cited strong momentum in the company’s U.S. business.
The company also updated its full-year revenue guidance. The company expects:
- Revenue in a range of approximately $2.88 to 2.91 billion, which would be growth of 18% to 19%
- Non-GAAP gross profit margin of approximately 64%
- Non-GAAP Operating Margin of approximately 16%
- Adjusted EBITDA Margin of approximately 25%
DexCom’s earnings growth has lagged others in its industry. The most recent quarter marked the first time in the past eight that the company posted earnings growth. Make no mistake: DexCom has been profitable every year since 2018, but earnings declined in 2021, to $0.66 per share, down from 2020’s $0.78 per share.
Analysts See Earnings Growth Ahead
For the full year 2022, Wall Street is eyeing earnings per share of $0.80, which would be a 21% increase. Next year, analysts expect net income of $1.11 per share, up 39%.
MarketBeat analyst data for DexCom reveal a “moderate buy” rating on the stock, with a price target of $120.24, just 3.94% below where it’s currently trading.
The DexCom chart shows that a rally attempt out of a cup-with-handle pattern broke down in April. The subsequent consolidation undercut the prior structure low, sinking to a nadir of $67.11 in mid-June when it began gradually etching the right side of the current consolidation.
The stock closed Friday at $115.96, down $3.88 or 3.24%. It finished the session below its 10-day moving average, but the stock is squarely in buy range, now that it’s pulled back from its November 1 high of $123.36.