 Customer relationship management software giant Salesforce (NASDAQ: CRM) shares fallen (-31%) in 2022. Salesforce is the largest enterprise customer relationship software (CRM) company in the world through acquisitions including Slack, Mulesoft, and Tableau. Despite macroeconomic uncertainty with inflationary and supply chain pressures, hybrid office, digital transformation and cloud migration are robust tailwinds for years to come. The Company is still growing revenues at 24% while bolstering its remaining performance obligation (RPOs) to $42 billion in fiscal Q1 2023. The Company has survived through recessions, bear markets, financial meltdowns, and global pandemics. Management claims to not have seen any material impacts from the weakening economic data as the demand environment remains strong. However, Salesforce did lower both its top and bottom lines guidance moving forward although margins were raised to 20.4% from 20%. The Company has resiliently survived every crisis in the last quarter century and has continued to grow revenues for 72 consecutive quarters. Prudent investors with a long-term horizon looking for exposure in the world’s #1 CRM company can watch for opportunistic pullbacks in shares of Salesforce.
Fiscal Q1 2023 Earnings Release
On March 1, 2022, Salesforce released its fiscal first-quarter 2023 results for the quarter ended April 2022. The Company reported earnings-per-share (EPS) profits of $0.98 versus a profit of $0.94 consensus analyst estimates, a $0.04 beat. Revenues grew 24.3% year-over-year (YoY) to $7.41 billion, beating analyst estimates for $7.38 billion. RPO ended Q1 at approximately $42 billion, a 20% YoY increase. Total cash and cash equivalents ended Q1 was $13.5 billion. Q1 non-GAAP operating margin was 17.6%. Salesforce Co-CEO Mark Benioff commented, “There is no greater measure of our resilience and the momentum in our business than the $42 billion we have in remaining performance obligation, representing all future revenue under contract. While delivering incredible growth at scale, we’re committed to consistent margin expansion and cash flow growth as part of our long-term plan to drive both top and bottom line performance.” Co-CEO Bret Taylor added, “Our financial results once again demonstrate the strength and durability of our business model as we continue to see strong demand from customers across the entire Customer 360 portfolio. Salesforce has become even more strategic and relevant to our customers as we are providing them with the agility and resilience, they need to drive growth and efficiency in these uncertain economic times.”
Downside Guidance
Salesforce issued downside guidance for fiscal Q2 2023 EPS of $1.01 to $1.02 versus $1.14 consensus estimates on revenues of $7.69 billion to $7.70 billion versus $7.77 billion analyst estimates. Fiscal full-year 2023 EPS is expected between $4.74 to $4.76 versus $4.66 consensus estimates. Revenues are expected between $31.7 billion to $31.8 billion versus $32.06 billion consensus analyst estimates. Non-GAAP operating margin guidance was raises to 20.4% from 20%.
Conference Call Takeaways
Co-CEO Benioff believes said they aren’t noticing any material impact yet from the economic data. The demand environment remains very strong, and the Company has proven its resiliency throughout the last 23 years. Salesforce has been able to weather through dot-com crashes, recessions and financial meltdowns and now global pandemics due to its incredible technology and business model. The Company learned from 2001 when they almost lost the business due to being on monthly contracts and didn’t have the right cash flow structure. This prompted many changes including the remaining performance obligation (RPO), which is the best measure of the momentum of the business, strength of the technology and durability of the business model. The RPO rose 20% YoY to $42 billion in fiscal Q1 2023. Forward guidance is being lowered to accommodate FX headwinds that have grown another $300 million growing to $600 million since Investor Day. He mentioned it’s a great time to be a tourist in Japan with the strength of the U.S. dollar, however, the Company is facing a (-12%) YoY headwind due to FX. The demand for its Customer 360 platform is incredibly healthy.
CRM Opportunistic Pullback Levels
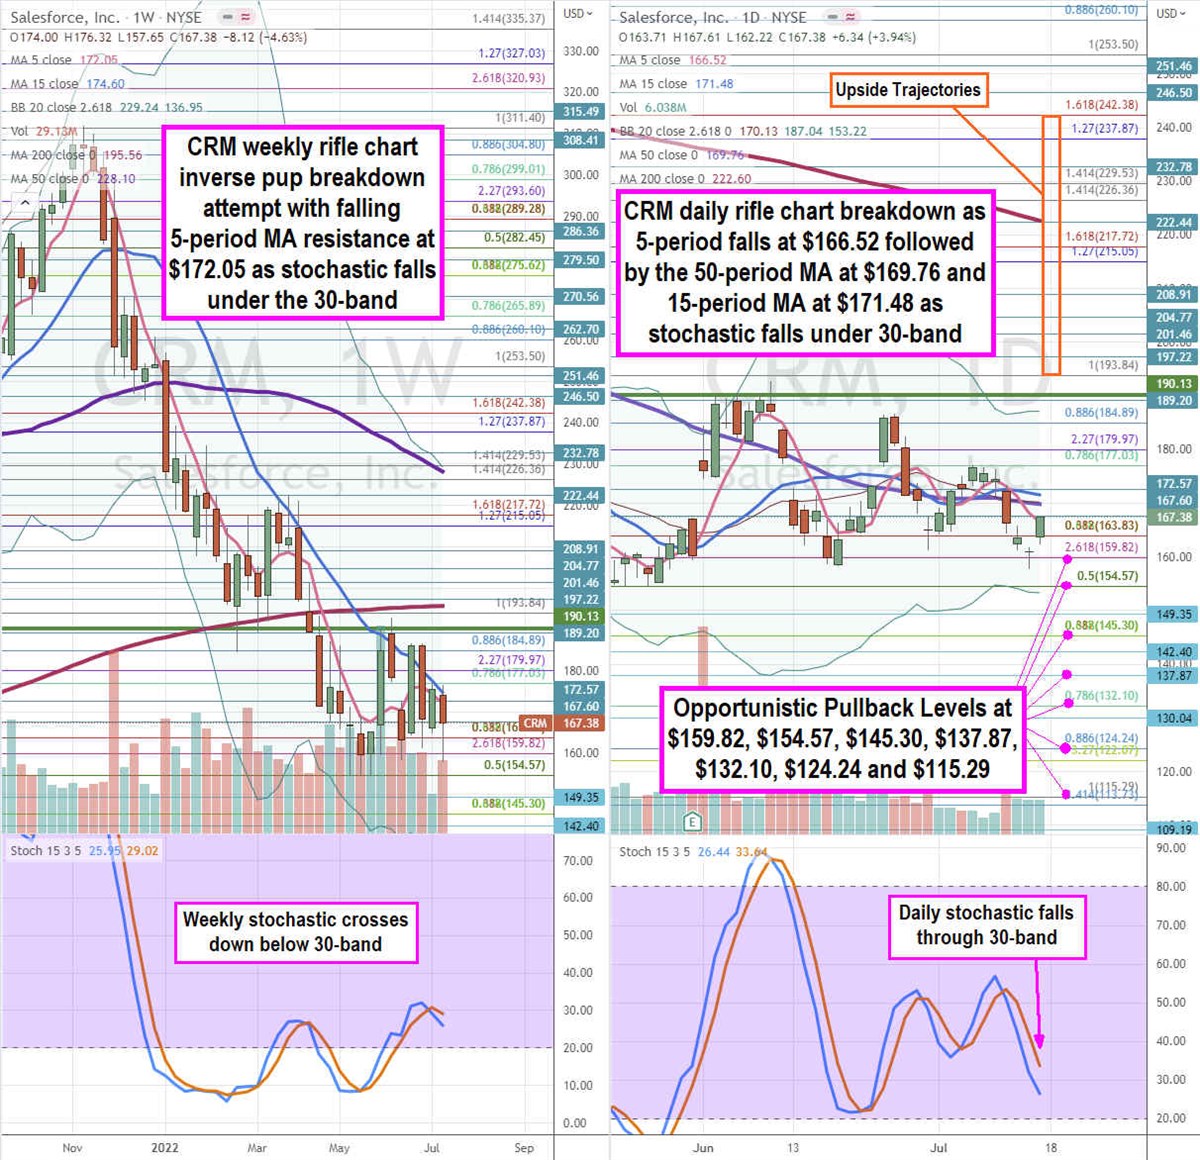
Using the rifle charts on the weekly and daily time frames provides a precision view of the landscape for CRM stock. The weekly rifle chart made a double bottom attempt at the $154.57 Fibonacci (fib) level before staging a rally to peak at the weekly market structure low (MSL) buy trigger at $190.13. Shares have fallen again on the weekly inverse pup breakdown with a falling 5-period moving average (MA) resistance at $172.05 followed by the 15-period MA at $174.60. The weekly 200-period MA resistance sits at $195.56. The weekly stochastic crossed back down through the 30-band. The weekly lower Bollinger Bands (BBs) sit at $136.95. The daily rifle chart has a tightening range as a breakdown attempts on the 5-period MA crossover down at $166.52 through the 15-period MA at $171.48 and 50-period MA at $169.76. The daily lower BBs sit at $153.22. The BBs have been in compression which precedes the expansion on a breakout or breakdown. The daily stochastic has fallen through the 30-band. Prudent investors can look for opportunistic pullbacks at the $159.82 fib, $154.57 fib, $145.30 fib, $ 137.87, $132.10 fib, $124.24 fib, and the $115.29 fib level. Upside trajectories range from the $193.84 fib level up towards the $242.38 fib level. Investors can also watch peers Workday (NYSE: WDAY) and Splunk (NASDAQ: SPLK)