 A bear market can trigger panic to a point where investors literally throw the baby out with the bath water. Bear markets always recover. The question is from what point and when. A bear market incites fear and capitulation on the way down and regret and fear of missing out (FOMO) on the way up. While professional money managers preach the stay the course mentality, the reality is that not all stocks are worth holding through a bear market. Many stocks will collapse and never recover. Bear markets are times to reassess which stocks are worth holding through the course of a bear market for a recovery afterwards. It’s also a time to go shopping for promising stocks that may have been too expensive during the bull market. Here’s how to determine which stocks are worth holdings through a bear market. The focus is on determining which stocks will participate in the recovery after the bear market passes.
Blue Chip S&P 500 Leaders and Best-of-Breed Stocks
The S&P 500 and benchmark indexes have not only recovered but surpassed prior highs from every bear market. However, keep in mind, the benchmark indexes always get adjusted to kick out the losing stocks and add winning stocks. Therefore, don’t assume your stocks will all recover based on the benchmark indexes. The best-of-breed stocks in the S&P 500 index are the most likely to lead the recovery. Always look for quality stocks with fortress balance sheets, relevant trends, leadership positions in the industry, and liquidity.
Value Stocks
A bear market can be relentless, and panic can crash stocks below their intrinsic value levels. The most basic valuation is the cash-per-share (CPS). Stocks trading at or below the CPS levels can be considered value plays. If a stock is trading below its CPS, then technically the business is free. Keep in mind, there may also be fundamental reasons for the weak valuations, so be sure these are not the anchor (IE: significantly lowered guidance, bankruptcy).
Secular Trend Stocks
Be aware of major secular trends in place like digital transformation, cloud computing, data warehousing and analytics, artificial intelligence, electric vehicles, clean energy, and so forth. Look for the best-of-breed or top tier stocks in these trends. If the top tiers are too expensive, then worth your way down. A key way is to find exchange-traded-funds (ETFs) specializing in these themes and then look at the weightings of its holdings. Make sure the ETFs have liquidity and volume since you might even consider taking the ETF rather than a single stock. For example, the First Trust Cloud Computing ETF (NASDAQ: SKYY) with 420,000 shares volume a day is preferrable over the Wedbush ETFMG Global Cloud Technology ETF (NASDAQ: IVES) with on 2,500 shares volume a day. From there, you can look up the holdings of the First Trust Cloud Computing ETF to get ideas on which stocks to consider taking a position in. The heaviest weighted holding is Pure Storage (NYSE: PSTG) with a 3.83% weighting trading around $26.82. As it turns out, the Company had an outstanding fiscal Q1 2023 earnings report on June 1, 2022. The Company grew top line revenues 50% to $630.4 million, with a record operating profits of EPS of $0.25 beating analyst estimates for $0.05 by $0.20. They also raised its forward guidance to $2.66 billion versus $2.59 consensus analyst estimates. The Company has $1.4 billion in remaining performance obligation (RPO) up 26%, subscription services revenues were up 29%, non-GAAP gross margin of 70.6%, and total cash of $1.3 billion.
Turnaround Beaten Up Speculation Stocks
As you go about your research, you will inevitably find stocks in secular trending sectors that are frankly cheap. Many of these stocks are under $10 or $5 for a reason and most will likely not recover. However, there will be many that are worth a speculative position as the percentage gains are easier to rack up with cheaper stocks . It’s also easier for a $5 stock jump 60% to $8, than a $100 stocks jumping to $160. The largest position size in the SKYY ETF turns out to be Rackspace Technology (NASDAQ: RTX) with a 12.7 million share position.
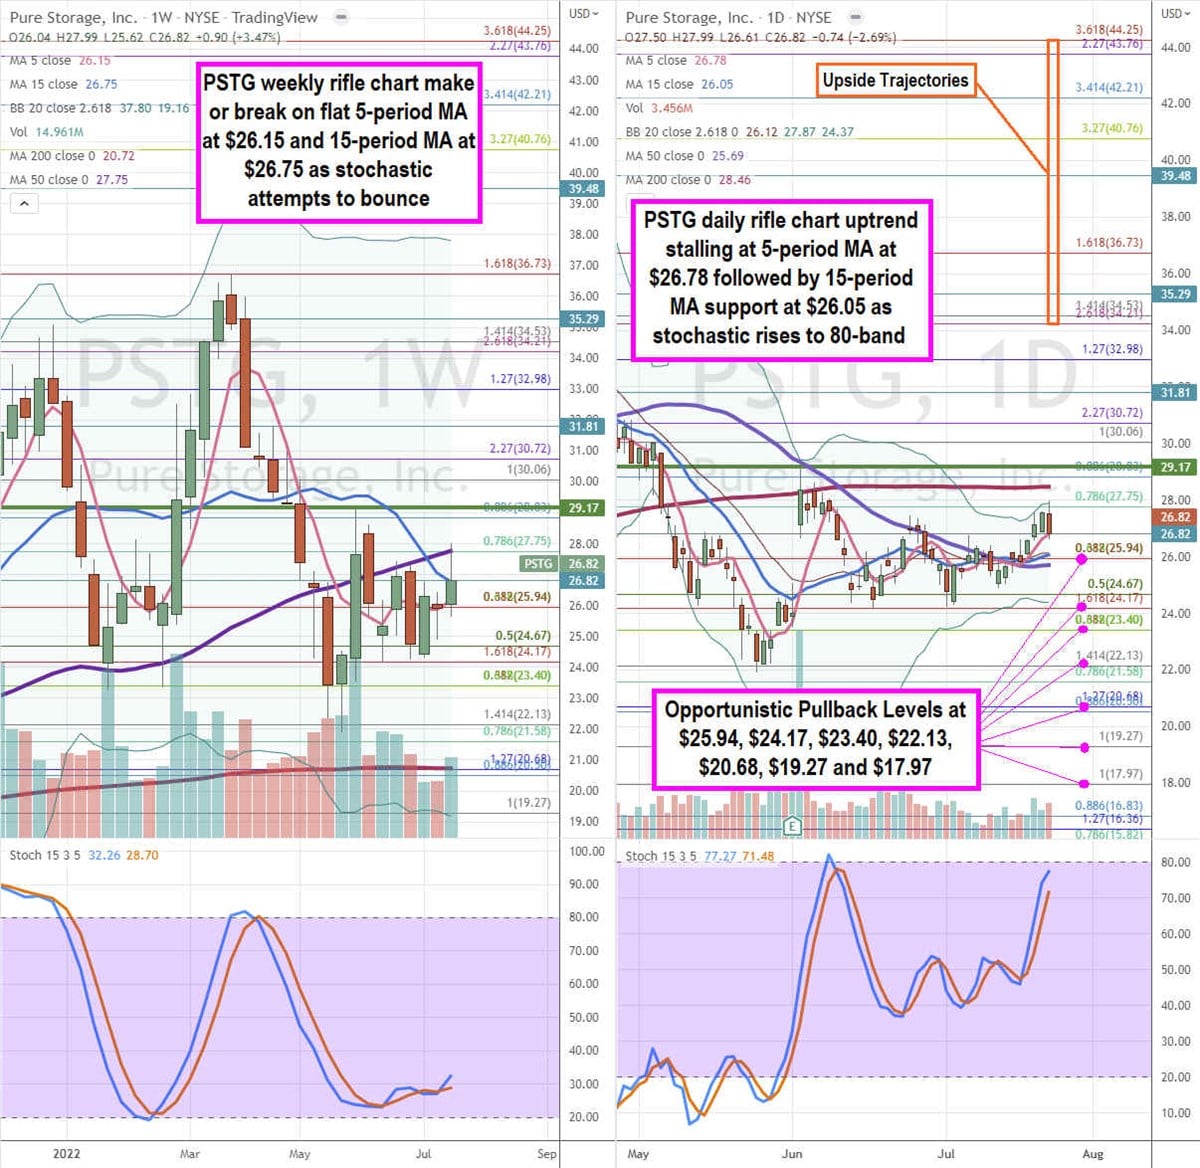
PSTG Chart Analysis and Entry Levels
Once you find stocks worth holding or taking a position in during a bear market. It’s time to analyze them technically on a chart. In this example, PSTG looks solid fundamentally now let’s look at PSTG using the rifle charts on a weekly and daily time frame provides for a precision view of the price action and determine entry levels. The weekly rifle chart downtrend stalled with a flat 5-period moving average (MA) at $25.94 followed by the 15-period MA at $26.75 and 50-period MA at $27.75. The weekly 200-period MA support sits at $20.68. The weekly lower Bollinger Bands (BBs) sit at $19.18. The downtrend bottomed of the $21.58 Fibonacci (fib) level. The weekly market structure low (MSL) buy triggers on a breakout through the $29.17 level. The weekly stochastic is trying to bounce up through the 30-band, which is still nearly oversold. The daily rifle chart has been uptrending with a rising 5-period MA support testing at $26.78 followed by the 15-period MA support at $26.05. The daily stochastic has risen to the overbought 80-band level and nearing the daily upper BBs at $27.87. The daily 200-period MA resistance sits at $28.46. Prudent investors can patiently wait for pullbacks on the daily stochs and look for opportunistic pullback entry levels near the $25.94 fib, $24.17 fib, $23.40 fib, $22.13 fib, $20.68 fib, 19.27 fib, and the $17.97 fib level. Upside trajectories range from the $34.21 fib level up towards the $43.76 fib level.


