The S&P 500 (NYSEARCA: SPY) 3rd quarter earnings reporting season is fast approaching and it's time to start preparing for what could be a very bad season. While there are some glimmers that inflation has peaked it's still high, biting into the bottom-line outlook, and compounded by supply chain problems both old and new. Those companies which still have strong businesses are having a hard time meeting the demand because of supply chain constraints while the weaker businesses are faced with a bloated inventory. The takeaway is the outlook for earnings and earnings growth is weakening and not expected to get any better with the FOMC on track to hike rates by another historic 75 basis points.
The Outlook For Earnings Growth Is Worse Than It Seems
The outlook for earnings has been in decline for the last two months, which is bad enough on its own, but there are some underlying details that make the situation worse than it appears. At face value, the consensus estimates for Q3, Q4, and the full year ticked lower to new lows over the past two weeks. The outlook for Q3 is now only 3.6% compared to the high of 11.6% set earlier this year. The consensus has fallen a full 800 basis points in that time and is on track to hit 0% by the start of the reporting season. This makes only the second reporting season since the pandemic bottom in which the consensus is falling and the pace and depth of the decline accelerated from the previous quarter.
The consensus for the 4th quarter has fallen less than the 3rd quarter outlook but that will likely change as the 3rd quarter reporting season wears on. As it is now, the Q4 consensus is 4.9% which is down 310 basis points from its high. Assuming the Q4 consensus falls in tandem with the current trends it is highly like that Q4 of 2022 will produce negative earnings growth and that is not good for S&P 500 index prices. The only ray of light in the outlook data is that consensus for C2023 ticked higher over the past two weeks but don't read too much into that. With the consensus for C22 in decline, the uptick in expectation for C23 is a function of this year's weakness and not next year's strength.
On a sector basis, the news is even worse. The consensus estimate for ten of the eleven S&P 500 sectors is in decline and only 4 are expected to show growth. Of those, only the Energy Sector (NYSEARCA: XLE) is seeing upward revisions and even here the pace of revision and expectation for growth is down from the previous quarter. More importantly, three of the most important sectors for the Q4 outlook are seeing massive downward revisions that have the Consumer Staples (NYSEARCA: XLY), the Materials (NYSEARCA: XLB), and Communication Services (NYSEARCA: XLC) sectors all looking at negative growth for the quarter.
The S&P 500 Technical Outlook: Nothing Bullish About It
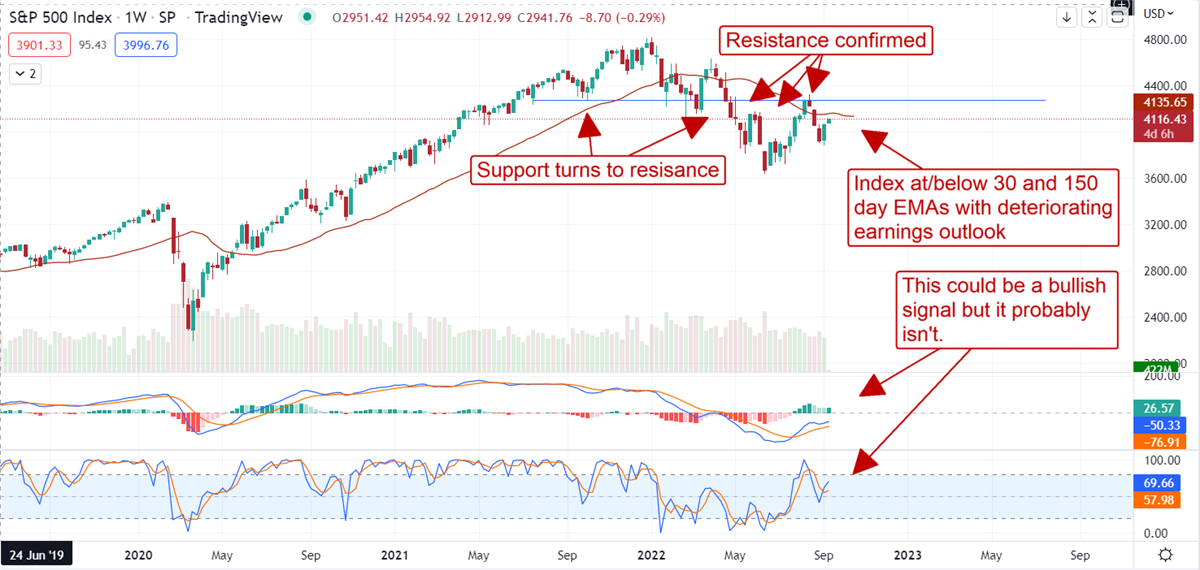
The weekly chart of the S&P 500 is showing an interesting technical setup because it highlights the largest flaw in technical analysis; the technical indicators and the signals they give are cold. That means that a buy signal and a sell signal often look identical which is the situation we have today. The index is set up in a way that could lead to an upside move but it is easy to read bullishness in the charts because most investors are bulls, not bears. In the context of the economic conditions and the dominant technical signals driving the market today, however, the index appears to set up a big fall that could easily take it down to a new low. The dominant technical signal is a long-term Head&Shoulders Reversal Pattern that has been in play since December of last year. This pattern was not only confirmed with a drop below the 4,100 to 4,300 level but it was reconfirmed not once but twice with follow-on declines from that same level.
So, the S&P 500 is in a relief rally and the chart looks like it could be set up for a move higher but resistance appears to be far stronger than support. Resistance can be counted at the 4,100 – 4,300 range which is a previous support level, the baseline of the H&S Pattern, a resistance point that was confirmed once, twice, three times and is now coincident with the 30 and 150-day EMAs. This combination, coupled with the expected earnings weakness, will not allow price action to move above 4,300 without a change in the fundamental outlook and there are few chances of that. The best-case scenario is that earnings for the broad S&P 500 will be better than expected and come with a favorable outlook for margins if not revenue growth. In that scenario, the index would likely move higher but it is far too soon to bet on that outcome now. If the index is going to move higher there will be a better signal than the one it's showing.