- The fine dining segment tends to hold up margins better than fast-casual restaurants
- Ruth’s raised menu prices by 7%, which helped to improve margins
- Shares are trading well below its average 17X forward earnings at 12X
Value is on the Premium Menu
Its dinner menu features USDA Prime and Choice grade steaks grilled to perfection in its proprietary 1800 degree broilers served up on a sizzling 500 degree plate. Beef comprises half its sales. The steak and seafood entrees range from $39.99 to $99.99 in price. It’s wines price from $45 up through $1,000 per bottle. The average dinner check was $89 in 2021. Food sales represented 81% of the check. The Company has seen volumes return to and exceed pre-COVID levels as comparable same store sales rose 18.6% compared to Q2 2019. Ruth’s opened two new Company-owned restaurants in Worcester, MA, and Long Beach, CA. Ruth’s plans to open four to five new restaurants in 2022 and five to six in 2023. The Company expects each new restaurant to generate over $5 million in annual sales with over 20% margins. The installation of its new booking and capacity data platform has improved demand forecasting and table management to drive comparative sales growth by 25% to 30% over 2019 levels. Shares are trading well below its average 17X forward earnings at 12X forward earnings with a 1.54% dividend yield presents an appealing value for long-term investors.
Here’s What the Chart Says
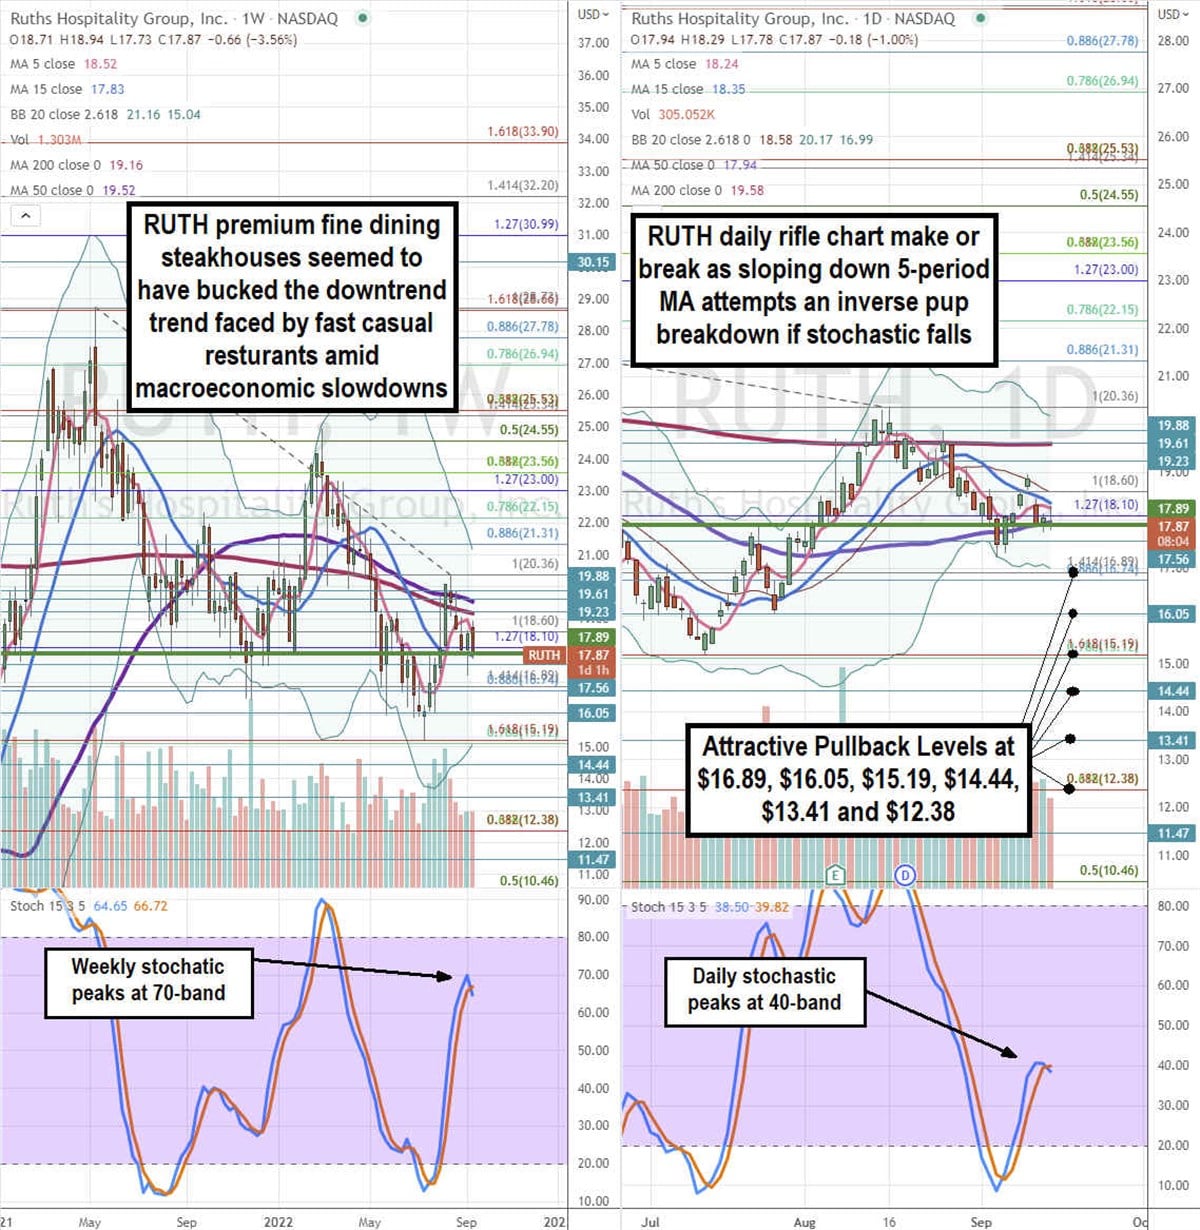
We use the rifle charts on the weekly and daily time frames to gauge a medium term interpretation on the price action for shares of RUTH. The weekly rifle chart made a solid bounce off the $15.19 Fibonacci (fib) level. The weekly stochastic coiled through the 20-band and triggered the weekly market structure low (MSL) breakout above $17.89 to peak at $20.36. The weekly stochastic peaked at the 70-band. The weekly 5-period moving average (MA) is sloping down at $18.52 with a flat 15-period MA at $17.83. The weekly 200-period MA resistance sits at $19.16 and 15-period MA at $19.52. The daily rifle chart is nearing a potential inverse pup breakdown as the daily 5-period MA resistance slopes down at $18.24 as shares test the daily 50-period MA at $17.94. The daily 15-period MA is falling at $18.35. The daily stochastic peaked at the 40-band and a cross down will trigger the daily inverse pup breakdown. Attractive pullback levels sit at the $16.89 fib, $16.05, $15.19 fib, $14.44, $13.41, and the $12.38 fib level.
Sizzling Earnings
On Aug. 5, 2022, Ruths released its fiscal second-quarter fiscal 2022 results for the quarter ending June 2022. The Company reported a non-GAAP diluted earnings-per-share (EPS) of $0.44, beating analyst estimates by $0.13. Revenues rose 16% year-over-year (YoY) to $128.65 million, beating analyst estimates by $4.17 million. Net income included a (-$6 million) loss no legal settlement and $8,000 income tax expenses related to the impact of discrete income tax items. Comparable restaurant sales rose 18.6% over 2019 pre-COVID levels. Food and beverage costs fell 56 bps to 29.8% YoY. Total beef costs decreased (-6%) YoY. The Company approved a new $60 million share buyback and $0.14 quarterly dividend. The Company paid down $10 million in debt and bought back $9.5 million of stock in the quarter. Ruth’s Hospitality Group CEO Cheryl Henry commented, “We were very pleased to deliver record performance for the quarter driven by strong demand from our guests. We generated double-digit comparable sales and solid margins, which led to adjusted earnings per share growth of 20% compared to 2021 and 41% compared to 2019. These results are made possible by our world-class teams serving the highest quality food with genuine hospitality each and every day.”


