Optical and photonics manufacturer Lumentum Holdings Inc. (NASDAQ: LITE) provides optical components and lasers to data centers, cloud providers, telecoms and the manufacturing industry. Its optical products enable telecom networks to transmit data and connect servers in data centers. Its lasers are used for welding, cutting and 3D printing. Its lasers are found in medical devices, including surgical and dental lasers.
The defense and NYSE: BA">aerospace industry uses its products in their targeting systems and rangefinders. The advent of artificial intelligence (AI) applications has surged the demand for its optical components and subsystems. AI applications require an ocean of data transmitted as quickly and efficiently as possible, which falls right into Lumentum's wheelhouse as its products enable high-speed data transmission.
Top Tier Customers
Its optical communications (OpComms) segment sells products and services that enable high-speed data transportation through optical fiber cables. This segment brings in 87% of the company's revenues. Customers include telecoms like T-Mobile US Inc. (NASDAQ: TMUS), Verizon Communications Inc. (NYSE: VZ), AT&T Inc. (NYSE: T), Deutsche Telecom and China Mobile.
Cloud providers include Alphabet Inc. (NASDAQ: GOOGL), Amazon Inc. (NASDAQ: AMZN) and Microsoft Co. (NASDAQ: MSFT). Datacenter customers include Equinix Inc. (NASDAQ: EQIX) and Digital Reality Inc. Its lasers segment accounts for 13% of total revenues. Customers include Medtronic plc (NYSE: MDT), Abbott Laboratories (NYSE: ABT), The Boeing Co. (NYSE: BA) and Lockheed Martin Co. (NYSE: LMT).
Declining Figures
On August 17, 2023, Lumentum reported its fiscal Q4 2023 results for the quarter ending June 2023. The company reported earnings-per-share (EPS) of 59 cents, beating consensus analyst estimates of 55 cents by 4 cents. GAAP operating loss was 15.1%, while non-GAAP operating margin was 9.1%. GAP loss per share was 88 cents compared to non-GAAP diluted net income of 59 cents. Revenues fell 21.3% year-over-year (YoY) to $370.8 million, beating analyst estimates of $365.38 million. Telecom and datacom revenues rose 2% YoY.
Lumentum CEO Alec Lowe commented, "With generational upgrades in the network's backbone and increased customer activity for AI in the data center, we expect year-over-year Telecom and Datacom growth in calendar 2024… We believe that the current customer inventory correction cycle will continue through the balance of the calendar year, and therefore, our shipments will be below end-market demand. During this transition period, we deliver as planned on our product roadmaps and are tracking ahead of our previously announced synergy plans."
Lowered Guidance
Lumentum lowered its fiscal Q1 2024 EPS of 20 to 30 cents versus 55 cents consensus analyst estimates. Revenues are expected between $300 to $325 million versus $366.59 million analyst estimates.
Customer Inventory Headwinds
Lumentum reiterated the significant headwinds with its direct and end customers actively trying to reduce inventory levels. The inventory correction cycle is expected to continue through the end of the calendar year. This will result in shipments being "well below" end-market demand, which drove the lowered guidance. However, the silver lining is that the company is still growing its market share outside the consumer market.
New Technologies Accelerating Demand
Lumentum is noticing dramatic strength in its data center (datacom) business as hyperscale clients are prepared to ramp up AI capacity. The company sees a significant YoY improvement in its telecom and datacom business in fiscal 2024. The increased AI activity for datacom translates into more shipments for its chip-level products for 800-gig transceivers and continuous wave (CW) lasers to connect server racks and AI clusters, which require higher data rates but low power. Ultrafast laser revenues rose 35% sequentially, and fiber laser sales rose 25% sequentially, offset by the lower solid-state lasers for chip applications.
Lumentum analyst ratings and price targets are at MarketBeat.
Lumentum peers and competitor stocks can be found with the MarketBeat stock screener.
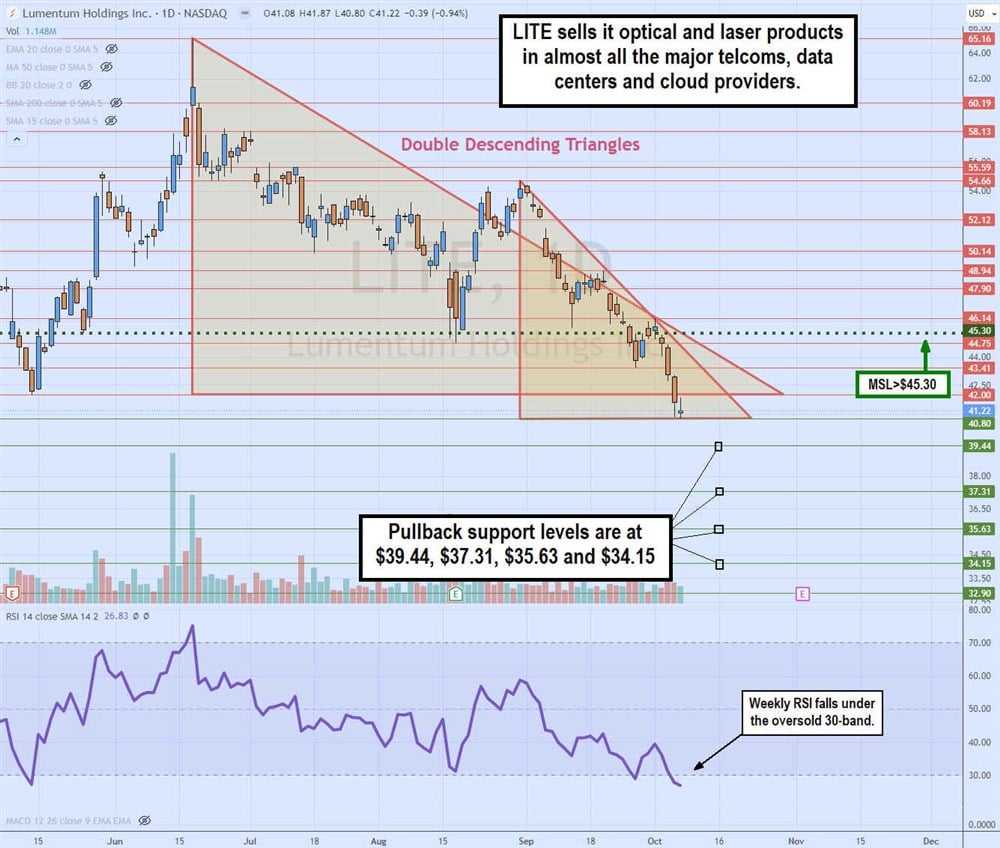
Double Descending Triangle
The daily candlestick chart on LITE illustrates two descending triangles. The major descending triangle commenced after peaking at the $65.16 high in June 2023, hitting a low of $42 by October 2023. After peaking at $54.66 on the major triangle failed breakout, the minor descending triangle formed, falling to a low of $40.80 in October.
The daily market structure low (MSL) buy signal triggered at $45.30 only to head-fake and collapse to the minor triangle horizontal trendline. The daily RSI has fallen through the oversold 30-band. Pullback support levels are at $39.14, $37.31, $35.63 and $34.15.