Shares of Lockheed Martin (NYSE: LMT) took flight after a better-than-expected report, and other defense contractors are doing the same. News from Northrup Grumman, the 6th largest by contract obligations, and General Dynamics (NYSE: GD) #3 have these stocks flying bull flags and set to extend recent rallies to new long-term highs.
What is a bull flag? A bullish flag is a technical chart pattern that signals consolidating markets gearing up for a rally. They occur in uptrends, are characterized by peaking and sideways movement, and typically result (but not always) in a break out to higher prices. The generally accepted targets for price action in such an event are based on the flag pole or magnitude of the rally preceding the flag, which is about 15% for each.
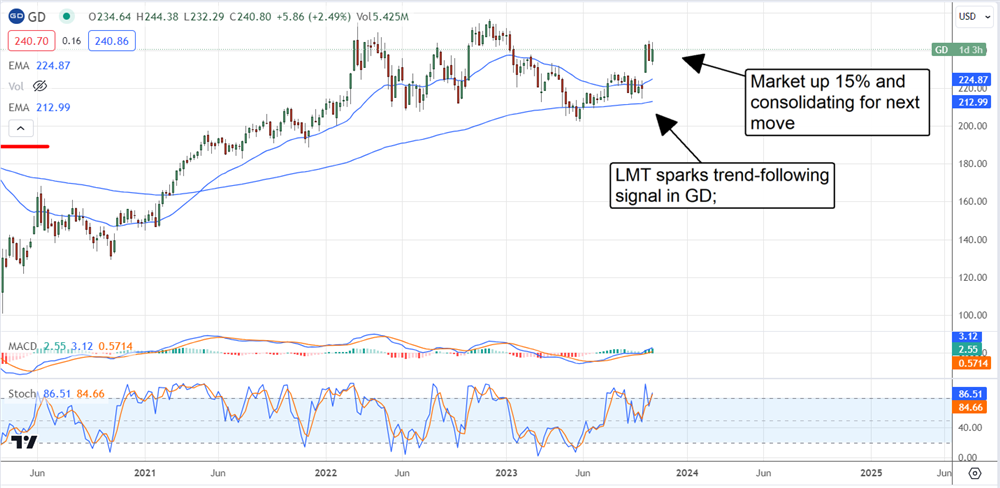
The takeaway for investors is that a high-probability 15% move is brewing for these high-quality dividend growth stocks. In both cases, such a move puts the market at a new all-time high, probably adding momentum to the move.
Northrop Grumman rises on record backlog
Northrop Grumman had a solid quarter with strength in all segments. The company reported top and bottom-line growth that outpaced the Marketbeat.com consensus estimates and revealed improved leverage. Revenue outperformed by 250 basis points to grow by 9%, while GAAP earnings are up 4.90% and outpaced by 680 bps. More importantly, strength is expected to continue with $15 billion in net awards during the quarter and backlog rising to record levels. Northrop Grumman execs also raised guidance, helping lift the market.
The company’s improved cash flow allowed the repayment of $1 billion in debt while also paying dividends and repurchasing shares. Repurchases and dividends came in at $0.5 billion compared to the nearly $1 billion in adjusted free cash flow. Repurchases are expected to continue substantially, with the full-year target of $2.5 billion only partially met, and buybacks will continue next year and continue lending support to the market.
NOC reaffirmed its guidance for 2024, which includes 20% FCF growth sufficient to sustain the distribution growth outlook. Northrop Grumman is on track to become a Dividend Aristocrat and should reach that level before the end of the decade. The only negative is the yield, which is low compared to peers. Lockheed Martin and General Dynamics both pay above 2.0%, Lockheed Martin close to 3.0%, compared to Northrop’s 1.55%.
General Dynamics gains momentum in Q3
General Dynamics reported in alignment with the defense contractor group. Revenue is up a mid-to-high single-digit pace with top and bottom line strength; the results outpaced consensus by about 500 basis points on strength in all segments and generated solid cash flow. Free cash flow topped $1.0 billion and was used to pay down debt, dividends, and repurchase shares. Notably, the backlog also hit a record, with book-to-bill coming in at 1.4:1 compared to Northrop’s 1.5:1.
Analysts are favorable to both names but more bullish on General Dynamics. They rate it a Moderate Buy compared to Hold for NOC, and both are trading near fair value relative to the consensus estimates. The difference is that General Dynamics' consensus estimate is firm and slightly higher than last year, while NOC’s has trended slightly lower. The upshot is that improving sentiment could be a trigger for either stock and may be expected due to the Q3 results.
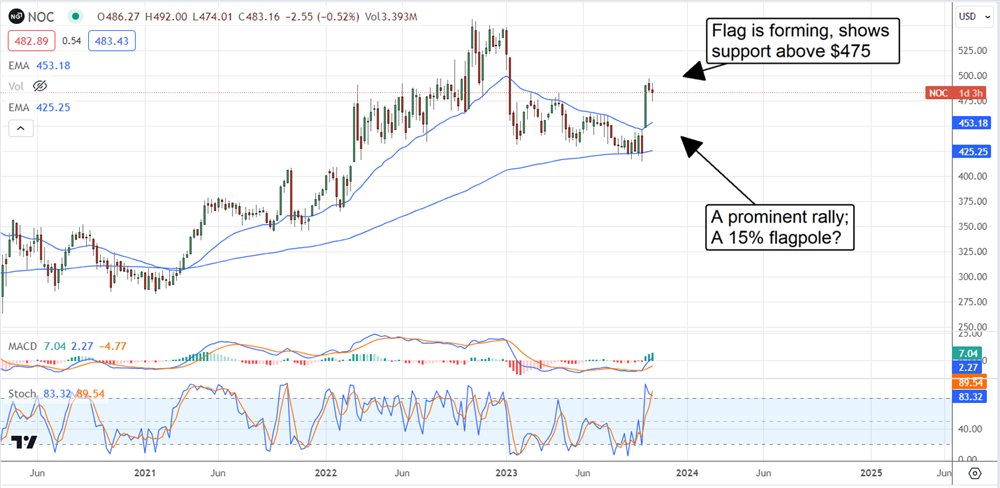
Price action in both stocks surged on the combined results of the defense sector and are now in consolidation. Northrup Grumman’s pattern is prominent, showing a clear uptrend and consolidation, with a break out expected any day. The critical resistance is near $495; once that level is broken, it should quickly reach the $550 level. Assuming the market follows through on the signal, it should continue to new highs.
General Dynamics' setup is nearly identical; the market is up on LMT news and consolidating, ready to move higher following its report.