Collaboration software developer Atlassian Co. (NASDAQ: TEAM) products enable work teams to operate more effectively. Over 250,000 customers use the company's workflow collaboration and project management software throughout 190 countries, including over 80% of the Fortune 500. Its workflow software is used by well-known enterprises, including Audi, Bloomberg, NASA, Roblox Co. (NASDAQ: RBLX), Splunk Inc. (NASDAQ: SPLK) and Zoom Video Communications Inc. (NYSE: ZM). Its recent earnings report revealed some growth deceleration, initially causing shares to sink 10%.
Riding the elastic office, remote and hybrid work trends
Over 40% of Atlassian's workforce work remotely, living at least two hours away from an office. It's Co-CEO Scott Farquhar commented that he may come into the office "about once a quarter." in a 60 Minutes interview. The company is capitalizing and practicing the secular tailwinds of remote and hybrid workflows. Its workforce is located throughout 13 countries.
Its remote hires jumped from 14% in 2020 to 54% in 2023. Having remote workflows enables the advantage of accessing a larger talent pool. Its cloud-based products enable teams to collaborate from anywhere with an internet connection. It's arguably the leader in its space within the computer and technology sector, competing with Asana Inc. (NASDAQ: ASAN), Slack owned by Salesforce Inc. (NYSE: CRM)) and Smartsheet Inc. (NASDAQ: SMAR). Check out the sector heatmap on MarketBeat.
Still growing and leading
On November 2, 2023, Atlassian released its fiscal first-quarter 2024 results for September 2023. The company reported EPS of 65 cents, beating consensus analyst estimates of 53 cents by 12 cents. Non-GAAP operating income was $224.9 million, up from $127.9 million in the year-ago period. Revenues rose 21% YoY to $977.78 million, beating analyst estimates of $966.29 million. The quarterly non-GAAP operating margin was 23%, up from 18% in the year-ago period. Quarterly subscription revenues climbed 31% YoY to $852 million. Quarterly cash flow from operations was $167 million, and free cash flow of $163 million.
The company launched Compass, a developer experience platform, into general availability. It enables teams to collaborate on a distributed software architecture on a unified platform. Its Jira Service Management incorporates artificial intelligence (AI) and machine learning to automate tasks and predict how long tasks take to complete and offers recommendations to improve workflow efficiency.
AirTrack acquisition
Atlassian made two acquisitions in the quarter. It acquired AirTrack, a leading data quality management technology provider. AirTrack will enable its Jira Service Management customers to be better accountable for tracking all critical assets to minimize operation risks, costs and attack surfaces. It increases Atlassian's footprint in the IT asset management market.
Loom acquisition
Atlassian acquired the Loom video messaging platform for $975 million. It enables users to record and share videos to elevate the collaboration experienced. This will allow Atlassian to accommodate the rise of distributed work. The Loom platform has over 25 million users. Co-CEO Farquhar commented, "We firmly believe distributed work is here to stay. Loom will allow teams across the globe, or even in the same building, to collaborate seamlessly and deeply human ways."
In-line guidance
Atlassian sees fiscal Q2 2024 revenues of $1.01 billion to $1.03 billion versus $1.02 billion consensus analyst estimates. It expects cloud revenues to grow 25% to 30% and data center revenue growth of nearly 31%.
Atlassian analyst ratings and price targets are at MarketBeat. Atlassian peers and competitor stocks can be found with the MarketBeat stock screener.
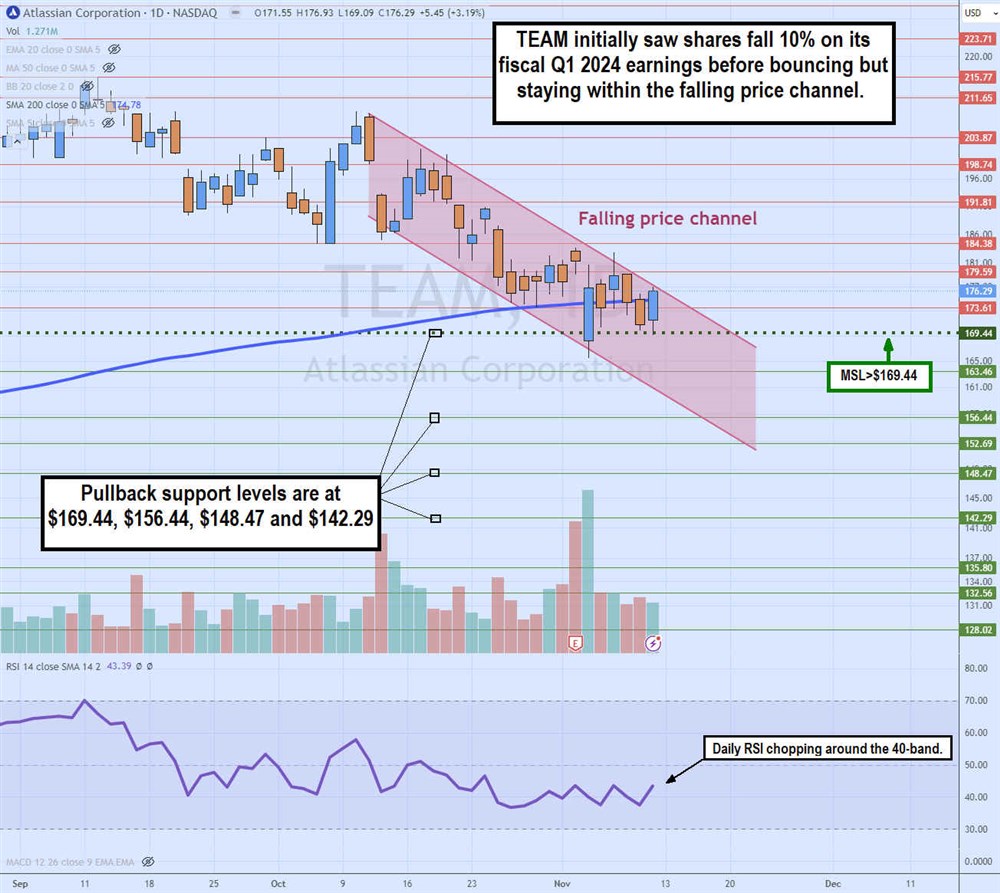
Daily descending price channel
The weekly candlestick chart on TEAM illustrates the descending or falling price channel. This is illustrated by the parallel descending upper and lower trendlines. The fiscal Q1 2024 post-earnings price plunge of 10% slightly overshot the lower trendline before bouncing back through the upper descending trendline.
TEAM fell back into the declining price channel but has tried to maintain support on the daily market structure low (MSL) trigger at $169.44. The daily 200-period moving average (MA) is flattening at $174.78. The daily relative strength index (RSI) has been chopping flat around the 40-band as it attempts to bounce. Pullback support levels are $169.44 daily MSL trigger, $156.44, $148.47 and $142.29.


