Whether Lowe's (NYSE: LOW) or Home Depot (NYSE: HD) is the better buy is pointless because both are high-quality retail names entrenched in the consumer landscape and pay great dividends. The question is, what kind of time horizon are we talking about? Each stock has different qualities to offer investors.
Home Depot trades at a higher valuation than Lowe's and deserves that premium. The business is twice the size of Lowe's and pays a more substantial dividend. That's good for nearer time horizons because a 2.7% annualized yield return is more bang for your buck than 2.15%, with or without distribution growth and share repurchases, which are also part of the equation.
Lowe's trades at a lower valuation, and its annual business is half the size of Home Depot, but it's the better buy for investors with longer to go until retirement because of the growth outlook. Not only is there a more significant opportunity for Lowe's to grow its business and increase its value, but for the dividend to grow as well. Lowe's pays a lower yield, about 2.15%, with shares near $200 but a smaller percentage of earnings, which lengthens the runway for distribution increases and the opportunity for compounding return.
Lowe's pays only 30% of its earnings, compared to a higher 55% for Home Depot. Both are in fine shape considering the history of annual increases, but Lowe's can sustain a higher pace of growth and can do it for a longer duration. Home Depot's distribution has grown at a 15% compound annual growth rate in the last five years, with the pace slowing to 10% most recently. On the other hand, Lowe's sustained a 20% CAGR for the last 5 years, slowing to 5% more recently.
Weakness in 2023 sets up buying opportunity for Lowe's
Shares of Lowe's are down following its Q3 results, but most of the weakness was already priced into the market. Lowe's stock corrected following the Q2 release, trading near the bottom of its range and forming a bottoming pattern. While the $20.47 billion in revenue was weaker than expected and coupled with a reduction in guidance, it could have been worse.
As it is, $86 billion in revenue and $13.00 in earnings is less than the previous forecast and below the Marketbeat.com consensus target but well within the low end of the expected range. This will weigh on the market but is a near-term problem, given the expectation for FOMC interest rates.
High interest rates are impacting consumer habits and have the economy on the brink of recession. The FOMC has not indicated the first interest rate cuts, but they are expected to come in early 2024. If so, it will release economic pressure throughout the system, invigorating Lowe's core DIY business and its growing Pro business. Even if the first interest rate cuts come later than expected, they are still on the way because the YOY inflation comps will soon do the Fed's job for them.
Analysts' activity keeps Home Depot and Lowe's range-bound in 2023
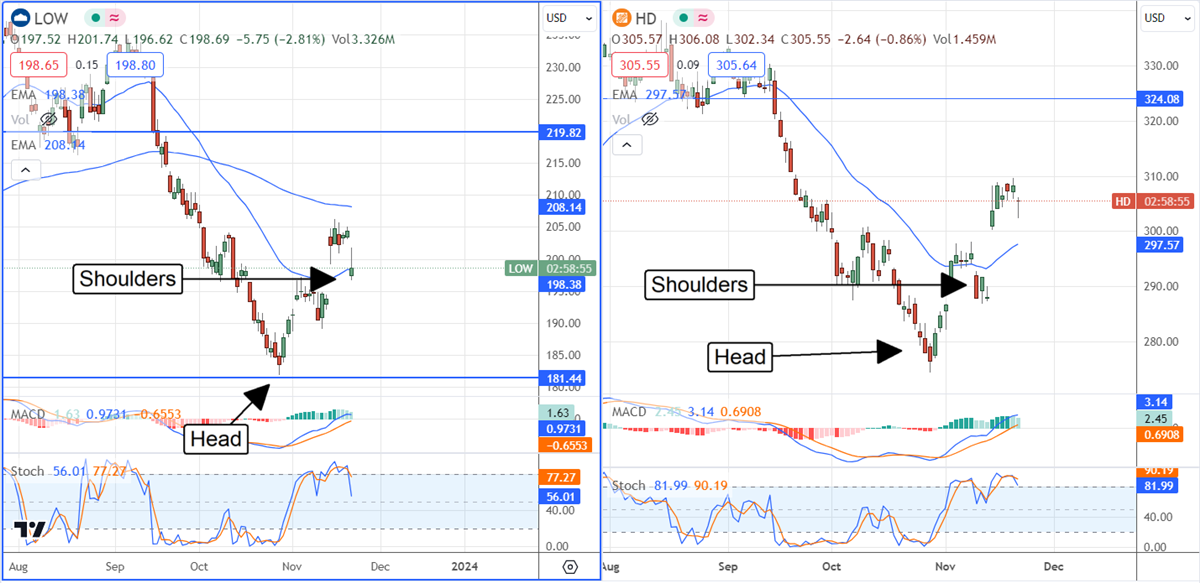
The analysts' activity in HD and Lowe's shares has been mixed in 2023 and is consistent with a range-bound market. Both are rated a Moderate Buy, trading in a range with a floor consistent with the low end of the analysts' target range. The consensus targets imply a 10% to 20% upside but are falling and have capped gains at the top of the range. Shares of the stocks should continue to sidewind within the range while these conditions persist and will not likely break out until they do.
The good news is that both markets are forming Head & Shoulder bottoms at the low end of their ranges. These patterns may not lead to a massive upside soon but should keep the markets above critical support at the low ends of the ranges. Investors looking to build positions in either of these stocks may want to target critical support for entry points.