Analysts note that HEICO Corporation (NYSE: HEI) benefits from cyclical strength in the commercial aerospace market. This low-yield, high-growth company is growing via demand for "the majority of our commercial aerospace products" and acquisitions, which have boosted the business into a hyper-growth phase. Acquisitions completed in 2023 include Exxelia for the electronic technology group and Wencor for the flight support group.
The result of its efforts and commercial business demand is a sustained uptrend in the share price that is taking the market to new highs. Because demand in the commercial aerospace and defense segments should persist and grow in 2024, this stock should continue to soar.
Marketbeat.com tracks 10 analysts with ratings on Heico, which isn't a lot compared to some stocks but is healthy for defense names. Trends within the data are also beneficial; the stock has doubled its coverage over the last 12 to 15 months, and the consensus price target is trending higher.
The price target is also leading the market and should continue to trend higher now that the Q4 results are in.
HEICO Corporation had a robust quarter
HEICO Corporation had a robust quarter with organic demand and two acquisitions to boost results. The company reported $936.45 million in revenue for a gain of 53.65% over last year. This record is driven by double-digit organic growth with organic and acquisitional growth in both operating segments. The flight support group grew by 75% net, 20% organic, while the electronic technologies group grew by 20% net and 6% organic.
Margin is another area of good news. Rising costs and acquisition expenses impacted the company's gross and operating margins, but less than expected. The operating margin contracted by 380 basis points to leave GAAP earnings at 74 cents (or 1,000 bps better than expected) and up 350 bps compared to last year, including 10 cents in acquisition costs. Because acquisition expenses will quickly dissipate, you can expect bottom-line strength in 2024.
The company didn't give formal guidance but provided an outlook for 2024 that was favorable to shareholders. The company expects organic and acquisitional growth during the year and another year of record-setting results.
Highly valued HEICO investing in growth
HEICO management focuses on growing the business and maintaining a healthy balance sheet to aid its strategy. The company leaned into some debt to help it with 2023 acquisitions, but leverage is still low and should fall over the coming year. Debt to income is just over 6x while net-debt-to-earnings before interest, taxes, depreciation and amortization (EBITDA) rose to 3x compared to 0.25x year-over-year (YOY).
The stock carries a high P/E multiple, about 3.5x greater than its closest competitors, which trade near 15x earnings, including Lockheed Martin Corporation (NYSE: LMT), Raytheon Technologies Corporation (NYSE: RTX), General Dynamics Corporation (NYSE: GD) and Textron Inc. (NYSE: TXT).
However, it has a more robust growth outlook to support the value and a dividend to help mitigate some risk. Regarding dividends, the yield is low at only 0.1% of the stock price but incredibly safe. The company pays less than 5% of earnings, preferring to invest in growth, but may lean into distributions as it matures.
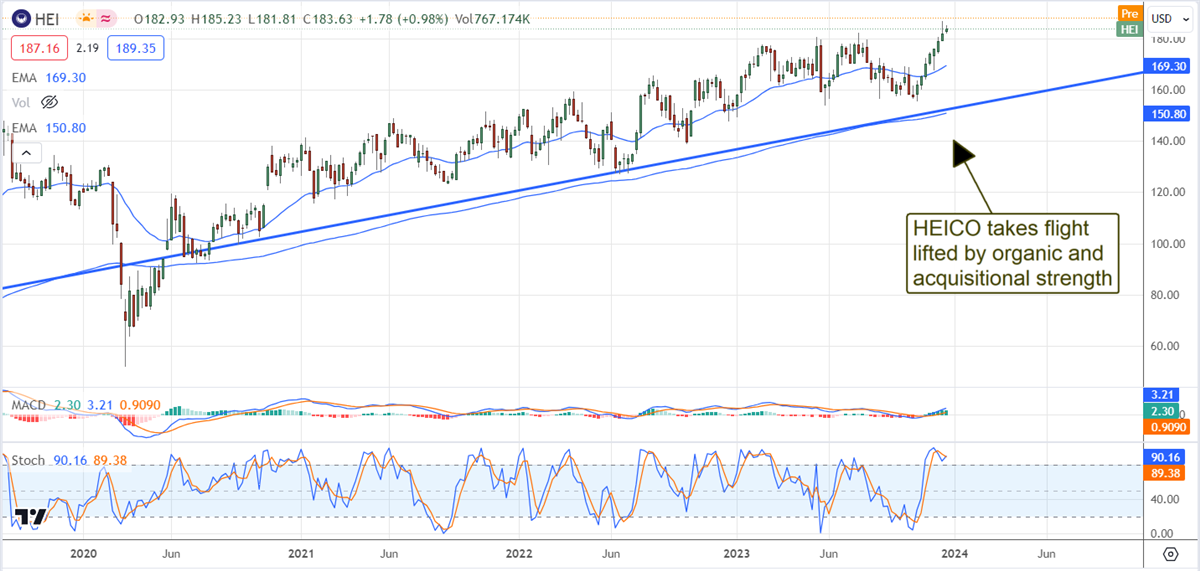
The technical outlook: HEICO flies to a new high, with an uptrend in play
Shares of HEICO are in a sustained uptrend and moving to new highs following the Q4 release. The price action is up more than 3% and may continue to trend higher over the next few months. However, because the price action is well above the 30-day moving average and created a gap with the post-release action, there is the risk of a pullback. In this scenario, the market may move toward the $180 level or lower in search of firm support before it advances further.