Cruise operator Royal Caribbean Group Ltd. (NYSE: RCL) is experiencing a record WAVE season, typically the first few months of the year when customers take advantage of cruise promotions. The seven biggest booking weeks in the company's history have occurred since November 2022.
Many industries like technology, feed delivery, and consumer discretionary are experiencing normalization pullbacks from the surge in pandemic business.
However, the NASDAQ: UAL">travel and leisure industry continues to experience positive normalization back to and above pre-pandemic levels.
Discretionary Spending Shifts From Goods to Services
While high inflation and macroeconomic uncertainty have caused consumers to pull back on discretionary spending, it’s been shifted from goods to services. Rather than buy apparel and electronics, consumers are opting to spend on travel and leisure experiences. These tend to be booked ahead of time, as Airbnb Inc. (NASDAQ: ABNB) noted that guests are booking further in advance for more extended stays.
Airlines are reporting record consumer demand as United Airlines Holdings, Inc. (NYSE: UAL), Delta Air Lines Inc. (NYSE: DAL), and American Airlines Group Inc. (NYSE: AAL) all raised their guidance. However, if the economic climate unravels into a recession, it will impact discretionary spending on services as well.
Chipping Away the Red
On Feb. 7, 2023, Royal Caribbean released its fourth-quarter earnings for December 2022. The company reported an adjusted EPS loss of $1.12, beating consensus analyst estimates for a loss of $1.34 by $0.22. GAAP net loss was $500.2 million or $1.96 per share. Revenues climbed 165% year-over-year (YoY) to $2.6 billion, missing consensus analyst estimates of $2.61 billion. Total revenues per passenger grew 3.5% and 4.5% in constant currency compared to Q4 2019.
Booking demand for 2023 as Q4 booking demand was significantly higher than pre-COVID Q4 2019. The momentum continued into 2023, setting up for a record-breaking WAVE season. Consumer spending, both onboard and pre-cruise purchases, continue surpassing prior years as guests absorb higher prices for participation, indicating healthy future demand.
Royal Caribbean CEO Jason Liberty commented, "We are experiencing a record-breaking WAVE season, resulting in a booked position approaching previous record highs and higher prices. This, along with the normalization of our booking window, provides the visibility for us to provide annual guidance, which is in line with our Trifecta program."
Forecasting Full-Year 2023 Profitability
Royal Caribbean provided in-line guidance for Q1 2023 with EPS losses between $0.65 to $0.85 versus $0.80 consensus analyst estimates. Full-year 2023 is expected to produce adjusted EPS profit between $3.00 to $3.60 compared to $3.32 consensus analyst estimates. Net cruise costs (NCC) minus fuel costs are expected to rise 8.3% as reported and 8.5% in constant currency compared to 2019. This includes 320 bps of additional structure costs, lagging transitional costs, and timing of expenses.
Analyst Reactions
Bank of America upgraded shares of RCL to Neutral with a $78 price target from Underperform and a $40 price target. Analyst Andrew Didora feels balance sheet risk has become more balance. The WAVE booking season is off to the strongest start based on capacity-weighted sequential pricing increases, with Royal Caribbean up 3.1%, Carnival Co. & plc (NYSE: CCL) up 1.4%, and Norwegian Cruise Line Holdings Ltd. (NASDAQ: NCLH) up 0.9%. He noted, “Over the past six pricing surveys, RCL has performed on average the best out of the three cruise lines. Overall industry pricing in 2023 was +2.6% while 2024 was +0.5% higher sequentially."
Wells Fargo analyst Daniel Politzer expects China re-opening to be a longer-term tailwind for Royal Caribbean and Carnival, “With China travel resuming and the cruise industry recovering, we estimate RCL and CCL reallocating pre-COVID levels of capacity back to China (6% and 4%, respectively) could support higher yields equating to +$6/share for RCL and +$1/share for CCL.”
Livermore Accumulation Cylinder
The weekly candlestick chart on RCL resembles a rare but powerful Livermore Cylinder named after the infamous trader Jesse Livermore. RCL bottomed out at $31.19 in July 2022 and made higher highs and lows in a zig-zag pattern. This is an accumulation pattern with expanding non-parallel higher highs and higher lows that conclude with a significant breakout and blow-off top. The resolution of this pattern could land shares above $100, but it's also essential to pay attention if the lower trendline breaks down.
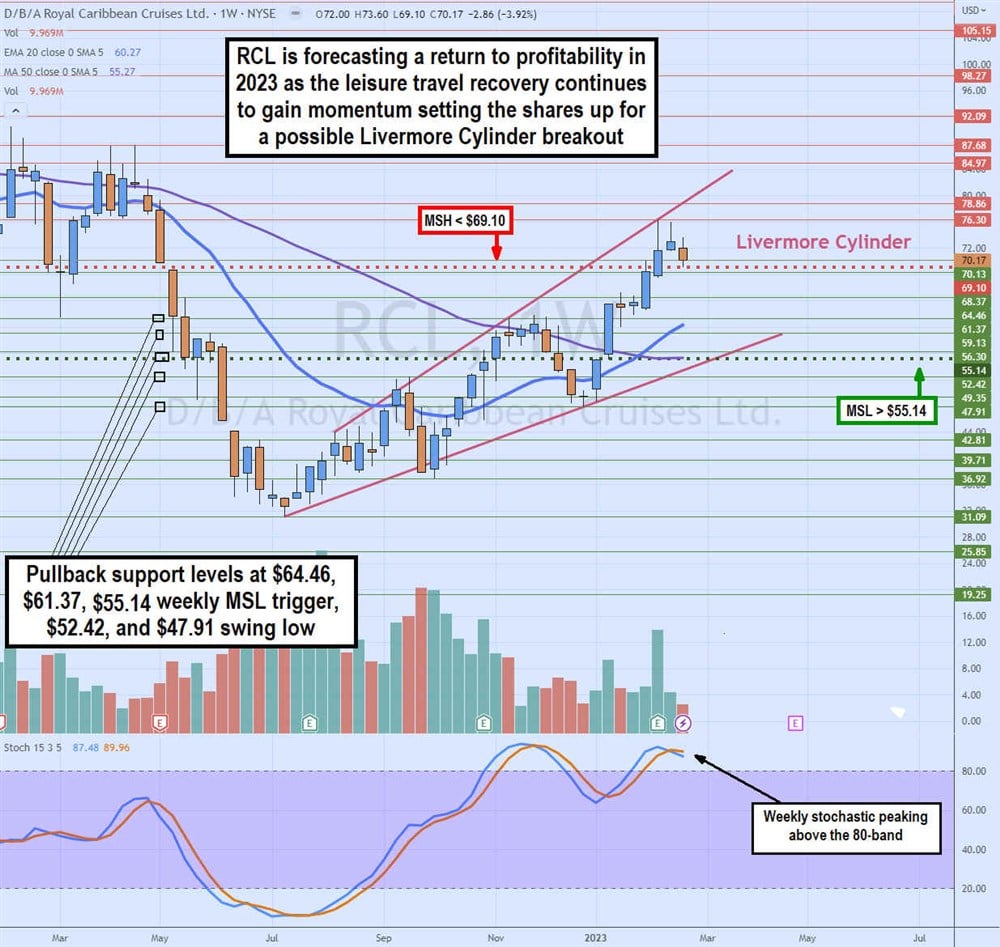
After a pullback to a new swing low at $47.91, RCL triggered the weekly market structure low (MSL) breakout through $55.14 in January 2023 as the weekly stochastic crossed back up through the 80-band. RCL continued to rally higher on six consecutive candlestick body highs, peaking at $76.30 before forming a weekly market structure high (MSH) sell trigger on a breakdown under $69.10.
The weekly 20-period exponential moving average (EMA) support is rising at $60.27, followed by the 50-period MA at $55.27. If shares trigger the MSH, an oscillation pullback may provide a favorable entry opportunity as long it makes a higher low. Pullback supports are $64.46, $61.37, $55.14 weekly MSL trigger, $52.42, and $47.91.


