
The market has been selling off bank stocks on fears of contagion stemming from the Silicon Valley Bank implosion and Signature Bank insolvency. Regional banks were the victims of panic selling. After the Credit Suisse Group AG (NYSE: CS) NYSE: CS">bailout by UBS Securities, there are rumblings of potential troubles at 'too big to fail' Deutsche Bank AG (NYSE: DB) as shares sank another (-5%) in the past week. Investors are rightfully worried about where the next blowup will occur in the NYSE: BAC">banking sector.
If NYSE: BAC">safety is your top concern over growth for regional bank stocks, then look at Sandy Spring Bancorp Inc. (NASDAQ: SASR) as a NYSE: CS">stalwart. Sandy Spring is a regional bank serving the affluent communities of Maryland, Virginia, and Washington D.C. markets with over 50 locations.
Impact of Rising Interest Rates
While rising interest rates may benefit banks, remember that banks invested in bonds at much higher prices. As the Fed raises the interest rate, those bond values continue to drop as yields rise. Paying interest on depositor funds becomes more expensive for a bank. Net interest margin fell to 3.26% in Q4 2022, compared to 3.51% in Q4 2021. Over half the loans at Sandy Spring are fixed rates, so even a 100 basis point rate move would only move the needle by 2% compared to 5% with larger banks.
Net Interest Margin Decline
Due to the increase in the rates paid on interest-bearing liabilities outpacing the increase in yields on earning assets, banks take a hit when the Fed makes aggressive rate hikes. Sandy Spring expects the net interest margin to reach 3.10% to 3.15% in Q1 2023. If the Fed pauses rate hikes, Sandy Spring could see a margin improvement of 5 bps to 10 bps per quarter.
Falling Non-Interest Bearing Income
Non-interest-bearing income dropped (37%) to $8.2 million due to the drop in mortgage banking and wealth management income. General macroeconomic weakness and rising interest rates dampening mortgage origination and refinance activity are the main headwinds. Assets under management grew to $5.26 billion, up from $4.97 billion in the year-ago quarter.
Capital Ratios
Sandy Spring's excellent risk-based capital ratio of 14.20% indicates a strong capital position. It's Tier 1 risk-based capital ratio is 10.23%, above the 6% regulatory minimum. Its Tier 1 leverage ratio is 9.33%, above the 5% regulatory minimum. Compared to some of the nation’s largest banks like JPMorgan Chase & Co. (NYSE: JPM) at 12.17%, Bank of America Co. (NYSE: BAC) at 10.49%, and Truist Financial Corp. (NASDAQ: TFC) at 9.2%.
Conservative Loan Portfolio Composition
Sandy Spring has a conservative $11.4 billion loan portfolio. Unlike Silicon Valley Bank, it doesn't do venture capital or technology start-up loans. It's mostly comprised of hard, cold real estate assets. The majority of its portfolio is comprised of investor real estate at 45%, which are income-generating properties and owner-occupied real estate comprising 16% of the portfolio. Commercial and industrial (C&I) loans account for 13%. Residential mortgages account for 11%. Acquisition, Development, and Construction (AD&C) loans account for 9% of the portfolio.
Commercial Real Estate (CRE) Loans
AD&C real estate loans are made to developers to finance the acquisition of land, and construction of buildings, and infrastructure. The underlying land or property development secures these deals. While the commercial real estate market is seeing softer demand, Sandy Spring concentrates more on the suburban properties servicing some of the country's wealthiest counties and communities, including Montgomery County, Potomac, and Anne Arundel County, Maryland and Fairfax, Loudon, and Arlington Counties in Virginia.
C&I Outpaces CRE
Sandy Spring has $1.7 billion in retail and $840 million in office exposure out of $4.7 billion in its CRE portfolio. Its office properties are suburban professional offices versus large four plates. Its funding is mainly limited to professional office space service medical offices and smaller unit offices that are easier to turn over. Sandy Spring is not a significant urban office funder. The slowdown in construction has led the bank to diversify its lending concentration by focusing on C&I as a growth driver. C&I has outpaced CRE growth in Q4 2022, reflecting that the efforts are paying off.
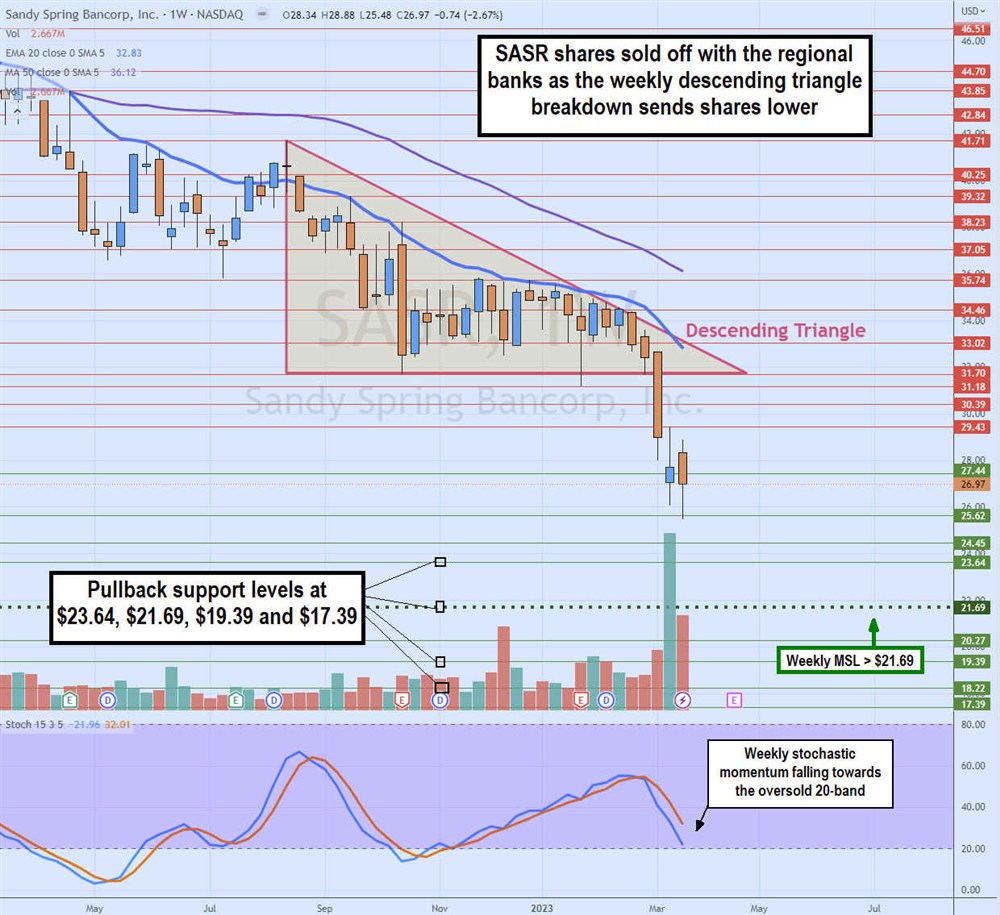
Weekly Descending Triangle Breakdown
The weekly candlestick chart on SASR shows the descending triangle breakdown through the $31.70 lower flat trendline during the first week of March 2023 when the Silicon Valley Bank implosion occurred. Shares are still attempting to form a higher weekly market structure low (MSL) trigger from the earlier $21.69 weekly MSL trigger. The weekly 20-period exponential moving average (EMA) falls at $32.83, followed by the 50-period MA resistance at $36.12. The weekly stochastic is falling towards the 20-band. Pullback supports are $23.64, $21.69 weekly MSL trigger, $19.39, and $17.39.


