
The Silicon Valley Bank implosion created a domino effect, with regional bank stocks NYSE: BAC">selling off to levels not seen in years. The key word here is NYSE: CS">contagion and the fear of it. NYSE: CS">Regional banks have seen deposits being pulled in record numbers to be redeposited with the bigger banks. First Republic Bank (NYSE: FRC) saw $70 billion in withdrawals, causing a bank run after Silicon Valley Bank was seized.
Conversely, central money center banks like Bank of America Co. (NYSE: BAC) reported $15 billion in new deposits afterward. The Charles Schwab Co. (NYSE: SCHW) reported over $16 billion in customer deposits. With regional banks falling over 25% this year, many investors may see this as an opportunity to step in at cheaper valuations. Rather than invest in any single stock, investors may consider diversifying with regional bank exchange-traded-funds (ETFs) to spread out the risk to many different bank stocks. Here are two ETFs that fit the bill.
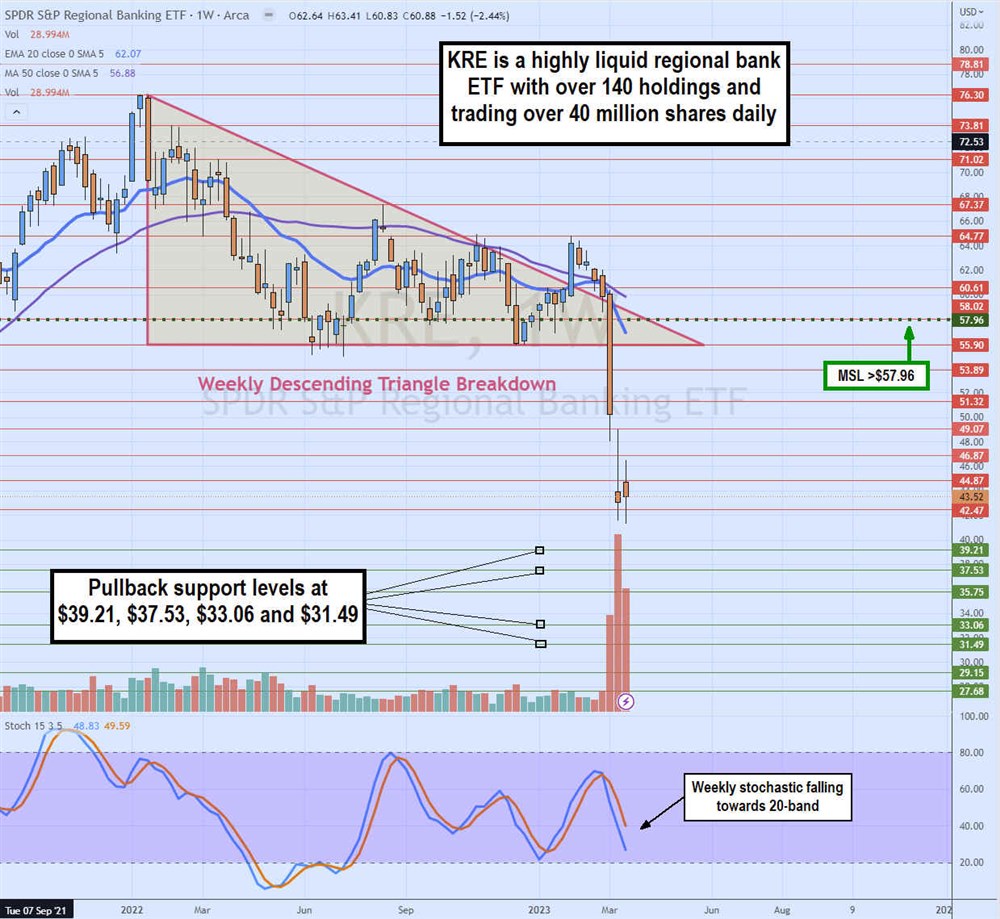
SPDR S&P Regional Banking ETF (NYSEARCA: KRE)
This ETF is the pulse of the regional bank segment. KRE tracks the performance of the regional banks in the S&P Total Market Index. It is incredibly liquid, trading over 45 million shares daily. It has 146 holdings with an average price-earnings (PE) ratio of 6.98 and a price-book (PB) ratio of 0.89. It has a weighted average market cap of approximately $6.1 billion. KRE has a 3.38% annual dividend yield. However, the risk is spread out since it's not concentrated heavily in any one bank.
Top Holdings
KRE has New York Community Bancorp Inc. (NASDAQ: NYCB) as its top holding with a 3.99% portfolio weighting. The company acquired certain Signature Bank assets, including deposits and some loans, which sent shares surging over 35% higher. It's one of the few regional bank stocks that are positive, up 3.5% on the year. NYCB received multiple upgrades following the well-received strategic move. Wedbush upgraded NYCB to Outperform with an $11 price target. D.A. Davison upgrades to a Buy with an $11.50 price target. Wedbush resumed with a Strong Buy and $13 price target.
Citizens Financial Group Inc. (NYSE: CFG) is the second largest weight at 2.97%. The bank is reportedly bidding to acquire the private banking unit of the defunct Silicon Valley Bank. The bank saw revenues climb 28% YoY and net interest income spike 51% in Q4 2022. Operating expenses rose 19% YoY as net interest margins fell by (64 bps). Weak mortgage banking led to a drop of (16%) in fee-based non-interest income.
Weekly Descending Triangle Breakdown
Most regional bank stocks have a similar weekly candlestick chart pattern of a descending triangle or rectangle breakdown. KRE displays a weekly descending triangle breakdown. Shares collapsed through the weekly market structure low (MSL) trigger at $57.96 and gained selling momentum, crashing through its flat bottom trendline at $55.90 as the weekly stochastic turned back down on March 6, 2023. KRE had seven lower lows but may attempt to put in a lower MSL trigger if it can form a higher low on a weekly candle. Pullback support levels are $39.21, $37.53, $33.06, and $31.49.
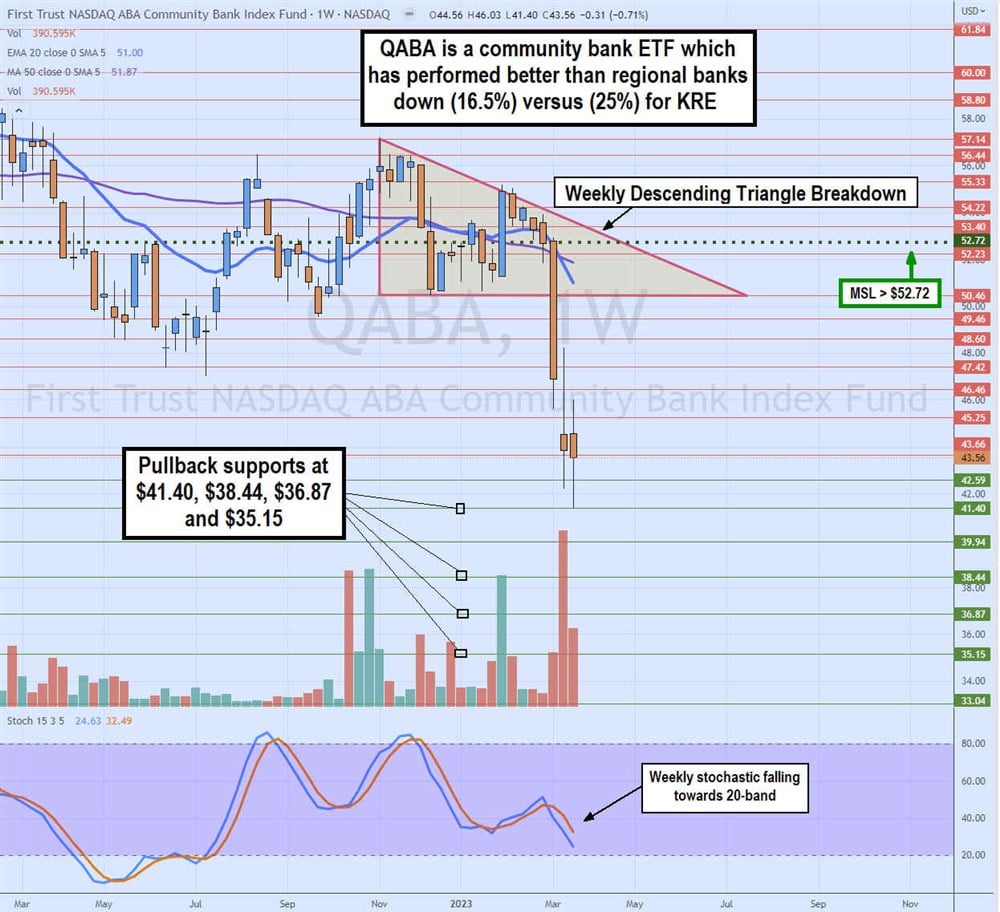
First Trust NASDAQ ABA Community Bank Index Fund (NASDAQ: QABA)
For investors that want to branch further out in the banking sector to even less volatile community banks, then QABA may fit the bill. QABA tracks the NASDAQ OMX ABA Community Bank index and pays a 2.73% annual dividend yield. This ETF is not as sensitive to sector sentiment like the KRE. This is evidenced by the performance of both. QABA is down (16.5%) versus KRE down (25%) for the year. It has a 2.53% annual dividend yield. The fund has 151 holdings. With less than $63 million in assets under management (AUM), the liquidity can be thin trading under 100,000 shares daily.
Top Holdings
QABA top three holdings include Commerce Bancshares Inc. (NASDAQ: CBSH) with a 3.76% portfolio weighting, Bok Financial Corp. (NASDAQ: BOKF) with a 2.97% weighting, and South State Corp. (NASDAQ: SSB) with a 2.88% weighting. Community banks seem to be somewhat sheltered from the panic selling in regional banks as evidenced by smaller declines. CBSH is down (14.5%) as its Q4 2022 revenues rose 10% YoY. It has a strong core deposit base as net interest income rose 22% YoY and net interest margin grew by 17 bps to 3.18%. Operating expenses rose 6% YoY.
Weekly Descending Triangle Breakdown
The weekly candlestick chart on QABA has a (surprise, surprise) weekly descending triangle breakdown. While the pattern is identical to the KRE, the magnitude of the drop is relatively smaller. The triangle formed after peaking at $57.44 in November 2022. Shares fell to the low of $50.46 in December 2022.
The weekly MSL formed at $52.72 and triggered twice to peak out at lower highs forming the falling trendline of the triangle. The breakdown occurred on March 6, 2023, as shares collapsed through the flat bottom trendline at $50.46. Like the KRE, QABA is also seeking a MSL trigger to form on the next higher low weekly candle. Pullback levels sit at $41.40, $38.44, $36.87, and $35.15.


