
The markets have been so volatile since the pandemic that boring and stable businesses that report in GAAP numbers are a welcome respite for investors. Industrial products and equipment manufacturer Illinois Tool Works, Inc. (NYSE: ITW) stock has been a safe haven for the risk-averse. Its one-year stock performance is up 5% compared to the S&P 500 down (11%) and the Nasdaq falling (14%) in the same period. The company makes essential tools and equipment products, serving seven segments comprising 87 global divisions.
Industrial Staples
ITW is akin to a consumer staples company for companies. Its essential products make it an industrial staples business. Its seven segments include construction products, food equipment, automotive original equipment manufacturing (OEM), specialty products, electronics, fluids, and welding. The business achieved a record Q4 2022 operating income.
Unlike so many businesses facing margin compression, ITW experienced operating margin expansion. The company navigated through supply chain challenges and cost inflation to deliver 12% organic growth. Momentum was so strong heading into 2023 that It also raised its profit estimates for the year.
Competitors
The company has many competitors within its seven segments. Some of them include Fastenal Co. (NASDAQ: FAST) for fasteners, 3M Company (NYSE: MMM) for its polymers and fluids, Emerson Electric Co. (NYSE: EMR), and Stanley Black & Decker Inc. (NYSE: SWK) for tools. As echoed by competitor Fastenal, ITW sees demand continue to soften with commercial construction.
Slow and Steady Wins the Race
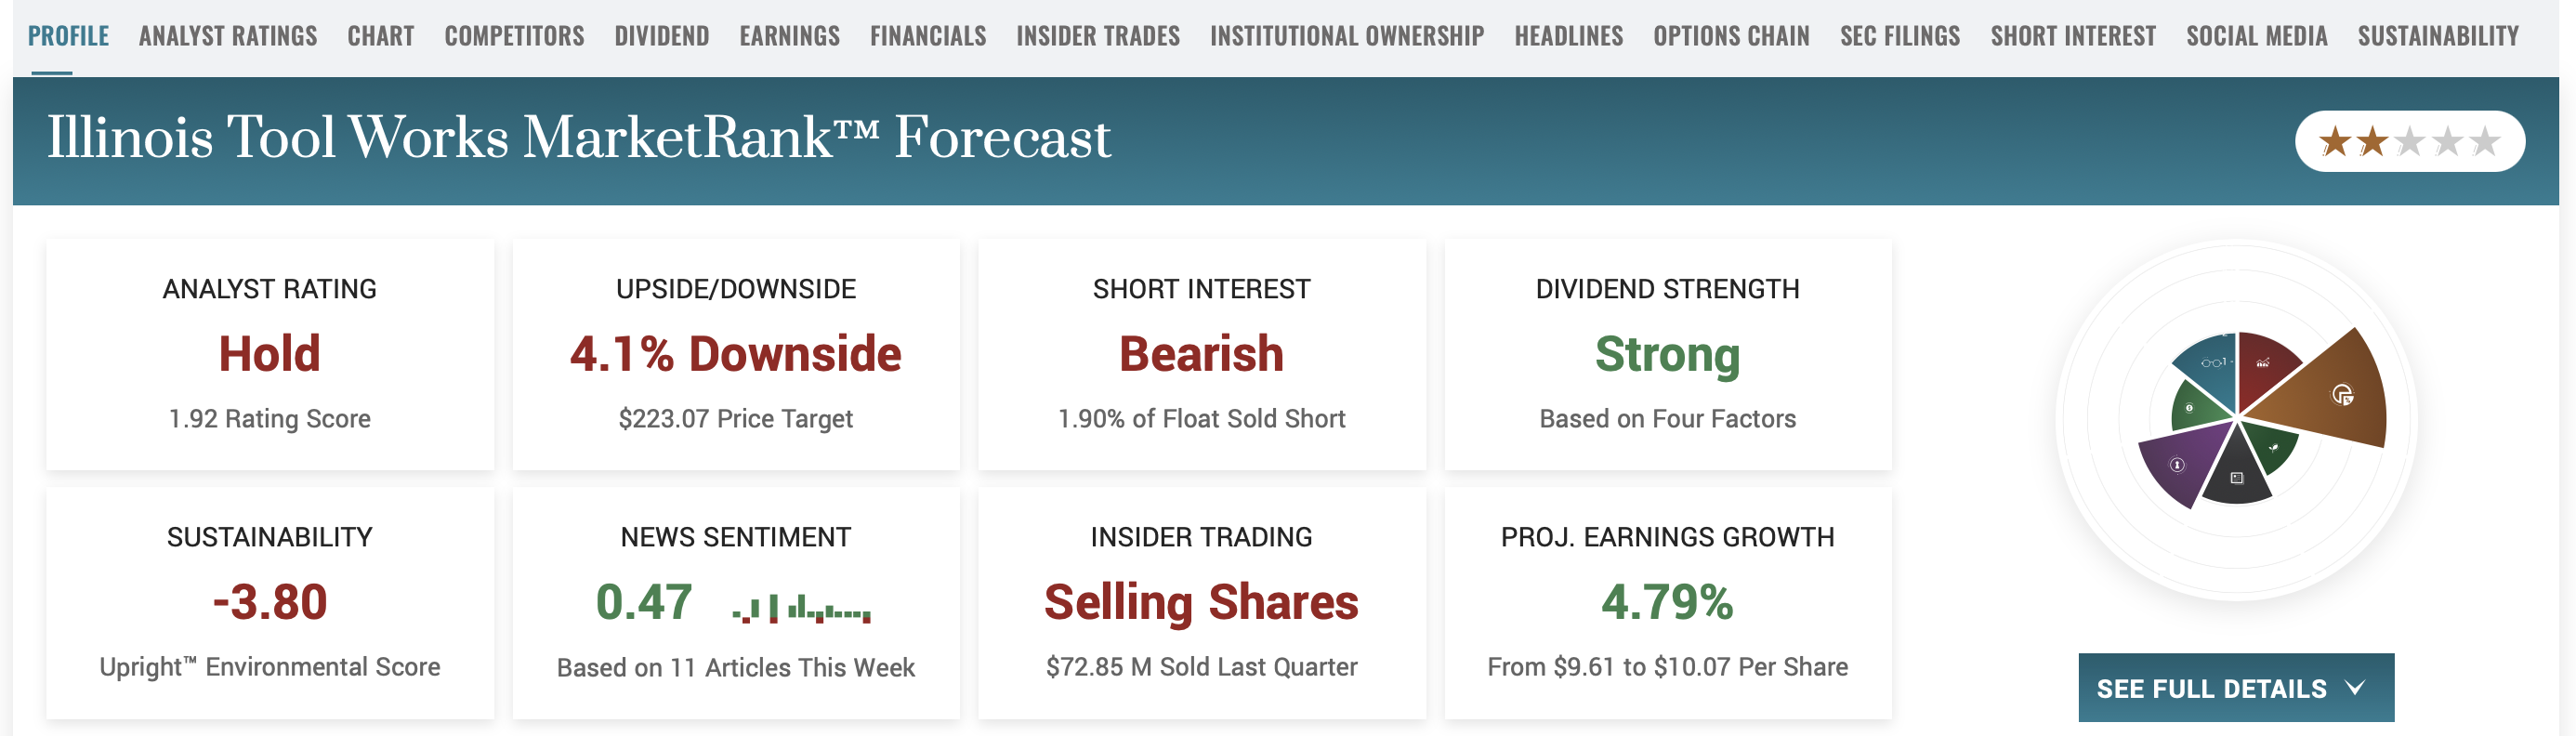
On Feb. 2, 2023, ITW released its fourth-quarter 2022 results for the quarter ending Dec. 2022. The company's GAAP earnings-per-share (EPS) profit of $2.95 includes the $0.61 of divestiture gains, which may not be comparable to the $2.53 consensus analyst estimates or missed by ($0.19) if backing out the divestiture gains. Revenues grew by 8% year-over-year (YOY) to $3.97 billion, beating analyst estimates of $3.90 billion. Foreign currency translations or the strong U.S. dollar headwind had a (5%) impact on revenues. The company declared a $1.31 dividend for shareholders of record March 31, 2023, with an ex-dividend on March 30, 2023. The dividend will be payable on April 13, 2023.
Segment Growth
Five of its seven segments had double-digit revenue growth. Automotive OEM led with 20% organic growth, attributed to supply chain issues last year. North America saw 15% revenue growth, while Europe had 23% YoY growth. China's revenues rose 17%, driven by noticeable strength in electric vehicles (EVs). Company-wide organic growth for the quarter was 13% in North America, 11% in Europe, and 9% in Asia.
Weakening Construction Offset by Strong Residential Housing Demand
The construction segment experienced a demand slowdown bringing the organic growth rate to 4%. Residential construction was up 11%, while commercial construction fell (6%) in the U.S. Part of the shortfall was due to robust comps of 21% growth in the year-ago period.
Lifting EPS and Lowballing Revenue Guidance
ITW raised its full-year 2023 guidance for EPS between $9.40 to $9.80 versus $9.34 consensus analyst estimates. The company is anticipating slowing demand in semiconductor-related end markets in addition to construction, commercial welding, auto aftermarket, and appliances. For this reason, they were cautious about top line revenue estimates. Organic revenue growth is expected between 3% to 5%. Operating margins are expected between 24.5% to 25.5% crediting enterprise initiatives to add up to 100 bps.
Weekly Rising Channel
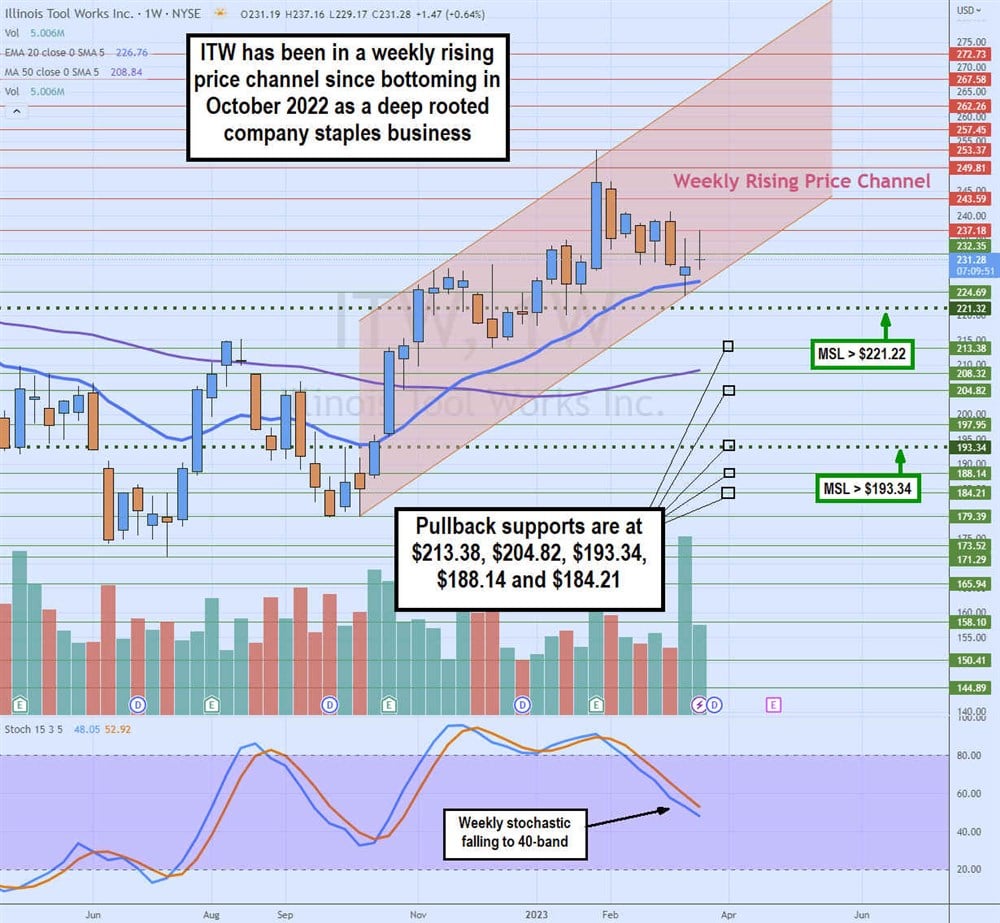
The weekly candlestick chart on ITW has been in a rising price channel since reaching a swing low of $179.39 in October 2023. Shares triggered their first weekly market structure low (MSL) on the $193.34 breakout powered by a rising stochastic. Shares triggered a second weekly MSL on the breakout through $221.32, driving the stock to a high of $253.37 at the end of January 2023.
The stock has been pulled back as the weekly stochastic oscillates towards the 40-band. The weekly 20-period exponential moving average (EMA) support is slowly rising at $226.43, with the weekly 50-period MA support below $208.78.
The pullback to the lower trendline bounced off $224.69, setting up another rising to the upper trendline or a breakdown through the trendline. Pullback supports are at $213.38, $204.82, $193.34, $188.14, and $184.21.