Dave & Buster's Entertainment Inc. (NASDAQ: PLAY) has been working hard to improve its operations and growth capability since the pandemic began. The restaurant rebound has helped drive revenue and earnings to levels well above pre-pandemic times.
In this light, Dave & Buster's stock trades at a deep value, echoing analysts' sentiment. The analysts lowered their targets following the third-quarter results, which may happen again now that fourth-quarter results are in, but the takeaway from their chatter is bullish. The analysts lowered their targets to a level where consensus expects a nearly 40% upside for share prices, and the stock is rated a "buy."
Dave & Buster's Knocks it Out of the Park
Dave & Buster's had a stellar fourth quarter, driven by organic growth, the acquisition of Main Event and a return of special event traffic. The company reported a record $563.7 million in quarterly revenue, a gain of 64.3% compared to last year. The revenue beat consensus by more than 300 basis points and is up 62% compared to 2019. The adjusted revenue growth, accounting for the acquisition of Main Event, is 28% year-over-year (YOY) and 30% compared to 2019, another strong figure. On a comp basis, store sales are up 19% across the network, with walk-ins up 12% and special event sales up 90%.
Margin news is favorable. The restaurant-operating income improved by 50 basis points to 30% of revenue, driving a similar increase in the company's operating margin. On the bottom line, the 80 cents in adjusted EPS is up 53% YOY, causing a healthy liquidity position for the company. The company's liquidity improved to $672 million, including $181 million in cash, with healthy cash flows expected to continue. The board declared a share repurchase program worth $100 million to investors, or about 5.7% of the post-release market cap.
Is a Dividend Cooking?
Dave & Buster's initiated a dividend in 2018 but had to suspend it in 2020 when the pandemic struck. That was a good move that helped to preserve capital in a time of need, but that time is over. The company is larger than before, with improved revenue-generating ability and healthy cash flow. The balance sheet is a fortress with ample liquidity, enough to initiate a share repurchase program so that the dividend may return soon. The former payout of 16 cents quarterly is worth about 1.7% annually, which would catalyze higher share prices.
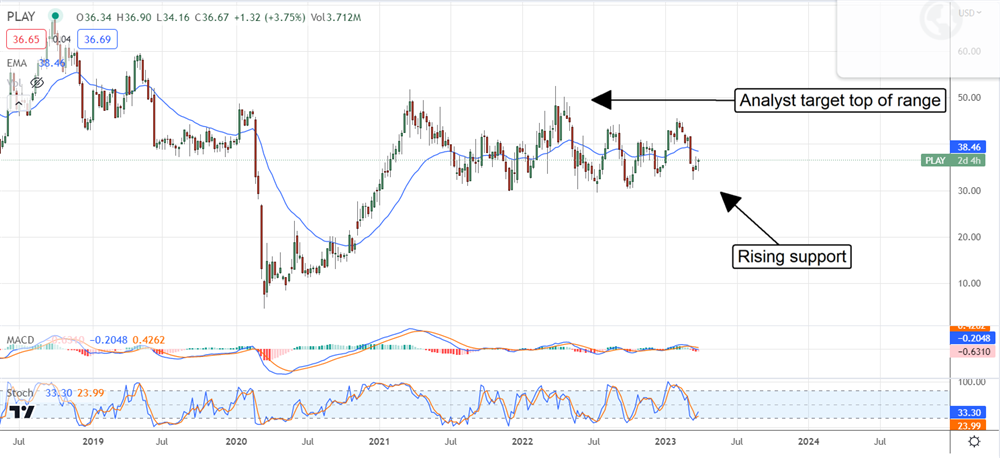
The charts show Dave & Buster's market trading near the bottom of a long-term trading range but showing signs of rebounding. The stock is up following the fourth-quarter release and offers support at the high end of the $30 to $33 range, a higher level than previously and a bullish indication within the trading range.
The next hurdle is the 150-day exponential moving average (EMA). If the market can get above that, a move to the top of the range is possible. The top of the range is near $50, consistent with the Marketbeat.com analyst consensus estimate.