Global entertainment and communications company Comcast Co. (NASDAQ: CMCSA) is the sum of all parts, generating a cumulative effect of stable and consistent growth. The company has transformed beyond being just a cable tv operator, although it still generates more than half its revenues from cable and broadband services.
It controls just over a 50% market share for broadband in the U.S., with over 57 million customers to Xfinity and Comcast cable. As the cord-cutting trend continues to grow, Comcast has found other ways to derive income and growth, mainly in the media and entertainment segments.
Distribution and Content Giant
It controls content distribution and creation through its cable tv network, NBC and Telemundo, and streaming services like Peacock. NBC Universal and DreamWorks studios comprise its film and TV content. It has Universal theme parks in California, Florida, Japan and China. It owns the Sky Group, comprised of Sky News broadcast and Sky Sports networks, one of Europe's most prominent entertainment brands. Comcast is a one-stop shop for investors looking for exposure in multiple industries that complement each other.
Competition from All Angles
With so many businesses, Comcast faces competition from all angles. It faces AT&T Inc. (NYSE: T) and Verizon Communications Inc. (NYSE: VZ) on broadband and wireless. It competes with Paramount Global (NYSE: PARA), Warner Brothers Discover Inc. (NYSE: WBD), and the Walt Disney Company (NYSE: DIS) on the film, tv, theme parks and streaming networks front. While the competition is heavy, it also has relatively strong moats. The company collects 52% of its revenues and 76% of its adjusted EBITDA from the cable communications segment, followed by 19% of revenue and 8% of adjusted EBITDA from its media segment. It's already investing in 10G broadband services.
Comcast vs. Disney
NBCUniversal ended 2022 as the #2 worldwide box office winner behind Disney. Its Peacock network added five million new paid subscribers with an average revenue per user (ARPU) of $10, but it still needs to gain a ton of money. The same can be said about Disney+ streaming services. While theme parks account for most of Disney’s profits and half its revenues, they only account for 6% of Comcast’s revenues and 2% of adjusted EBITDA.
Steady as She Grows
On Jan. 26, 2023, Comcast released its fiscal fourth-quarter 2022 results for the quarter ending December 2022. The company reported an earnings-per-share (EPS) profit of $0.82, excluding non-recurring items, versus consensus analyst estimates of $0.78, beating estimates by $0.04. Revenues rose 0.7% year-over-year (YoY) to $30.55 billion, beating analyst estimates of $30.36 billion. The company had 365,000 wireless customer net line additions. Peacock added $5 million in new paid subscribers. Sky added 129,000 net additions in all markets.
Fiscal Full-Year 2022 Recap
For the fiscal full-year 2022, cable communications adjusted EBITDA hit the highest full-year margin in history. Cable communications added 75,000 real relationships and broadband added 250,000 new customers. Peacock revenues tripled to $2.1 billion. Theme parks saw a $1.4 billion increase to $2.7 billion as the pandemic passes in the rearview mirror. Sky adjusted EBITDA rose to $2.5 billion, up 7% YoY and 20.3% in constant currency.
Comcast CEO Brian Roberts commented, "We achieved the highest levels of Revenue, Adjusted EBITDA and Adjusted EPS in our history and returned a record $17.7 billion of capital to shareholders. We delivered impressive revenue growth in broadband; grew wireless lines by 1.3 million, our best result since launch; more than doubled our Peacock subscribers, surpassing 20 million at year-end; nearly tripled Peacock revenue to $2.1 billion; ranked second in the worldwide box office; and generated record Adjusted EBITDA at our theme parks.”
Weekly Bull Flag
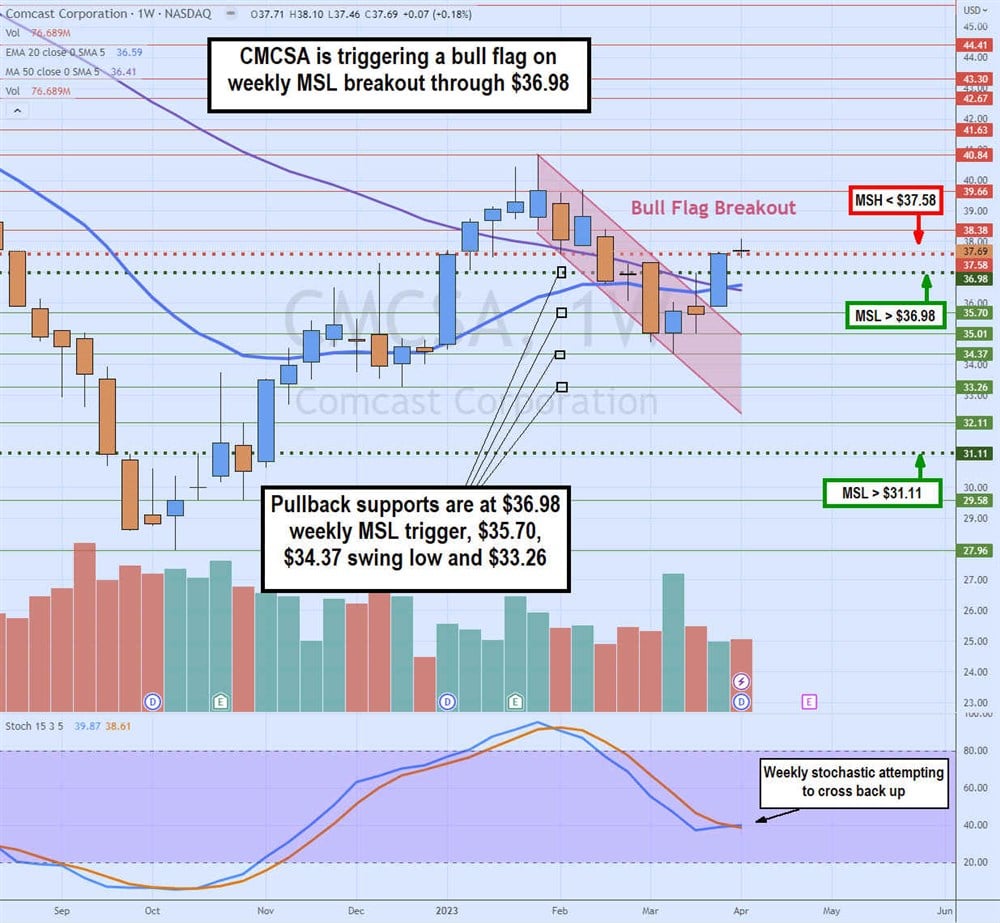
The weekly candlestick chart on CMCSA indicates the beginning of a bull flag breakout. Comcast rallied from a low of $27.96 in October 2022 to a peak of $40.84 at the end of January 2023, forming the flagpole. Shares descended with parallel lower highs and lower lows to bottom out at $34.37 in March 2022. Shares triggered the weekly market structure low (MSL) buy trigger at $36.98 to test the weekly market structure high (MSH) sell trigger at $37.58.
The weekly stochastic is attempting to cross up through the 40-band. The weekly 20-period exponential moving average (EMA) at $36.59 has just crossed the 50-period MA at $36.43. This indicates a breakout being powered by a stochastic bounce forming a bull flag breakout. Pullback supports are at $36.98 weekly MSL trigger, $35.70, $34.37 swing low and $33.26.