
The Silicon Valley Bank bankruptcy shook the regional bank sector as investors panicked and NYSE: JPM">depositors quickly transferred their money to larger financial NYSE: JPM">institutions like JPMorgan Chase & Co. (NYSE: JPM) or Bank of America (NYSE: BAC). Fifth Third Bancorp (NASDAQ: FITB) stock nosedived from $36.70s to a low of $21.84 in six days in March 2023 during the regional bank fallout.
Fifth Third shares were arguably undeservedly lumped in with the failed banks, but it proved to be a stalwart with access to $102 billion in liquidity sources. The bank sees growth accelerating after the Silicon Valley Bank failure. Fifth Third provided more color on its operations with its fiscal Q1 2023 earnings release.
Consumer Deposit Segment
In its Q1 2023 quarterly earning presentation, Fifth Third provided highlights for its consumer and commercial deposit franchises. They indicated that 69% of its consumer customers are digitally active, and over 80% of the balances are from customers who've been with the bank for more than five years. Its consumer segment accounts for 55% of its deposit mix. Over 92% of its consumer customers have more than one Fifth Third Bank product, and 88% of deposits are FDIC insured.
Stable LCR
It reported that 71% of retail is stable per liquidity coverage ratio (LCR) reporting. LCR is a regulatory requirement under Basel III for banks to ensure resiliency in liquidity stress situations. Banks must have high-quality liquid assets that can be converted to cash to cover net cash outflows during 30 days. It expects consumer checking household growth of 3.1%, driven higher by the Silicon Valley Bank failure.
Commercial Deposit Segment
Nearly 88% of commercial deposit balances are relationships that use Treasury Management Services (TMS), including 73% of uninsured balances. TMS is a suite of services that business clients can utilize to manage daily operations and improve fiscal operating efficiency. Some of the platform's key features include payables, receivables, fraud and liquidity management, real-time reports and analytics.
The balanced weight average relationship is 24 years. The median relationship deposit balance is $375,000. The Silicon Valley Bank failure didn't affect the new commercial relationship growth rate. Most of its commercial accounts are for businesses in professional services, other services, healthcare, manufacturing, and public administration.
Limited CRE Exposure
Its exposure to commercial real estate (CRE) is limited to just 7.1% of its loans, and 70% of those are for class-A properties. Class A properties are considered the best modern constructed, well located, highest quality and well maintained commercial property that usually commands a premium rent from top-tier tenants.
The average loan commitment is $9.5 million, and delinquencies are 0.01%. Fifth Third President and CEO Tim Spence commented on the Q1 2023 earnings call, “From a credit risk perspective, our low CRE concentration and commercial and in particular in office CRE, along with our focus on homeowners in consumer should prove to be significant advantages.“
Boring is Good
On April 20, 2023, Fifth Third released its fiscal first-quarter 2023 results for the quarter that ended March 2023. The company reported diluted earnings-per-share (EPS) profits of $0.78 versus $0.77 consensus analyst estimates, a ($0.01) miss. The company noted a ($0.05) headwind for certain expenses, if backed out, would equate to a 20% YoY increase. Net interest income was $1.52 billion, up from $1.20 billion in the year-ago period. Revenues rose 18% to $2.22 billion.
Non-interest income fell to $696 million from $735 million QoQ as the net interest margin slipped to $3.29% from 3.35% QoQ from Q4 2022. Credit quality was strong, with a net charge-off ratio of only 0.26% which was also the rate of early-stage delinquencies. Average total deposits were flat quarter-over-quarter (QoQ). The company expects revenues to grow from 6% to 8% in 2023. Fifth Third Bancorp analyst ratings and price targets can be found on MarketBeat.
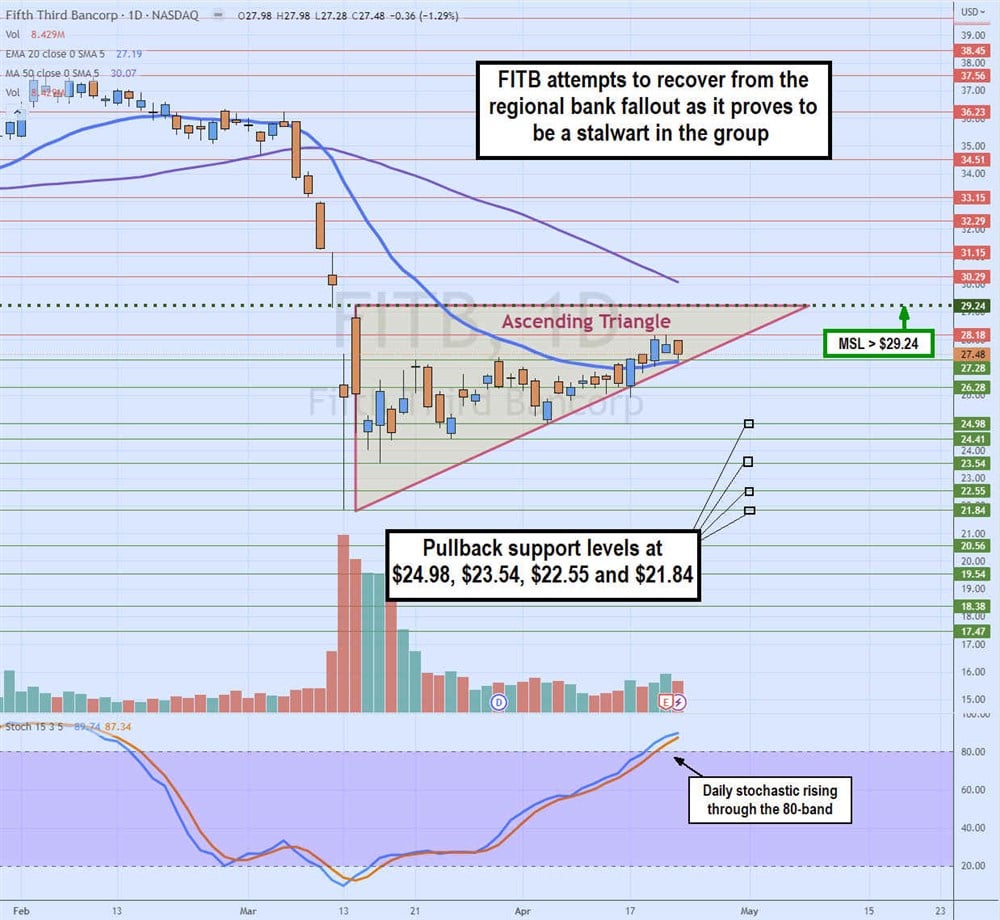
Daily Ascending Triangle
The daily candlestick chart on FITB formed an ascending triangle after making the low of $21.84 on March 13, 2023. The higher low triggered the next day to form a daily market structure low (MSL) trigger on a breakout through $29.24. While shares have not triggered the daily MSL, they have been making higher lows, as the rising trendline illustrates.
The daily stochastic has fully oscillated from the 10-band towards the 90-band. The daily 20-period exponential moving average (EMA) support is flat at $27.19, while the 50-period MA resistance continues to fall at $30.07. Pullback support levels are $24.98, $23.54, $22.55 and $21.84.


