Global container shipping company ZIM Integrated Shipping Services Ltd. (NYSE: ZIM) stock has been selling off since its last April 3, 2023, dividend payout of $6.40 per share. The shipping industry is continuing to face normalization, and ZIM is no exception as freight rates continue to decline.
The company noted that 2022 was an outlier year as the company did exceptionally well despite normalization in the shipping industry. Competitors include TORM plc (NASDAQ: TRMD), Euronav NV (NYSE: EURN), Diana Shipping Inc. (NYSE: DSX) and Genco Shipping & Trading Ltd. (NYSE: GNK).
The company operates 152 vessels, of which 12 are car carriers, with an average remaining 27.3 months. The company ended 2022 with $4.6 billion in total liquidity. While the company expects that falling freight rates will be near the bottom and the company will see volume improvement in 2023, JPMorgan Chase (NYSE: JPM) disagrees. They downgraded shares of ZIM back to Neutral with a $20.80 price target on April 21, 2023.
Smaller Dividends in 2023
The company expects EBITDA of $1.8 billion to $2.2 billion in 2023. This is down from the full-year 2022 adjusted EBITDA of $7.5 billion and distribution of $3.3 billion in dividends or 44% of net income. Critics argue that the estimates are still too lofty as other shippers forecast net losses in 2023.
Strong Finish for 2022
On March 13, 2023, ZIM released its fourth-quarter 2022 results for the quarter ending in December 2022. The company reported an earnings-per-share (EPS) profit of $3.44, excluding non-recurring items, beating consensus analyst estimates by $3.05. Revenues were $2.19 billion, beating consensus analyst estimates of $2.09 billion. The company declared a dividend of $6.40 per share, paying out $779 million back to shareholders. ZIM paid out $2.04 billion in dividends, or 44% of total net income in 2022.
CEO Comments and 2023 Forecasts
ZIM CEO Eli Glickman commented, "While macroeconomic uncertainties, the precipitous decline in freight rates over the past few months and the supply-demand imbalance continue to drive a challenging near-term outlook for container shipping, we are confident in ZIM's strategy and believe we will generate positive EBIT in 2023.
The company expects positive EBIT in 2023. It expects full-year 2023 adjusted EBITDA between $1.8 billion to $2.2 billion and adjusted EBIT between $100 million to $500 million. Returning substantial capital to shareholders is a top priority. The company has $4.6 billion in cash and investments heading into 2023.
JPMorgan Flip Flop
On February 16, 2023, JPMorgan upgraded ZIM shares to Overweight from Neutral with a $30.40 price target, up from a $17.60 price target. However, on April 21, 2023, JPMorgan downgraded shares of ZIM back to Neutral from Overweight, cutting its price target from $27.00 to $20.80. Analyst Sam Bland questions the longevity of the sharp increase in spot rates as he feels they may be temporarily driven by ongoing contract negotiations on the TransPacific to drive customers to accept higher contracted rates.
He commented, "This makes us question the longevity of the spot rate increase, absent any more meaningful improvement in demand.” Bland also thinks ZIM may be too aggressive in its guidance. ZIM analyst ratings and price targets can be found on MarketBeat.
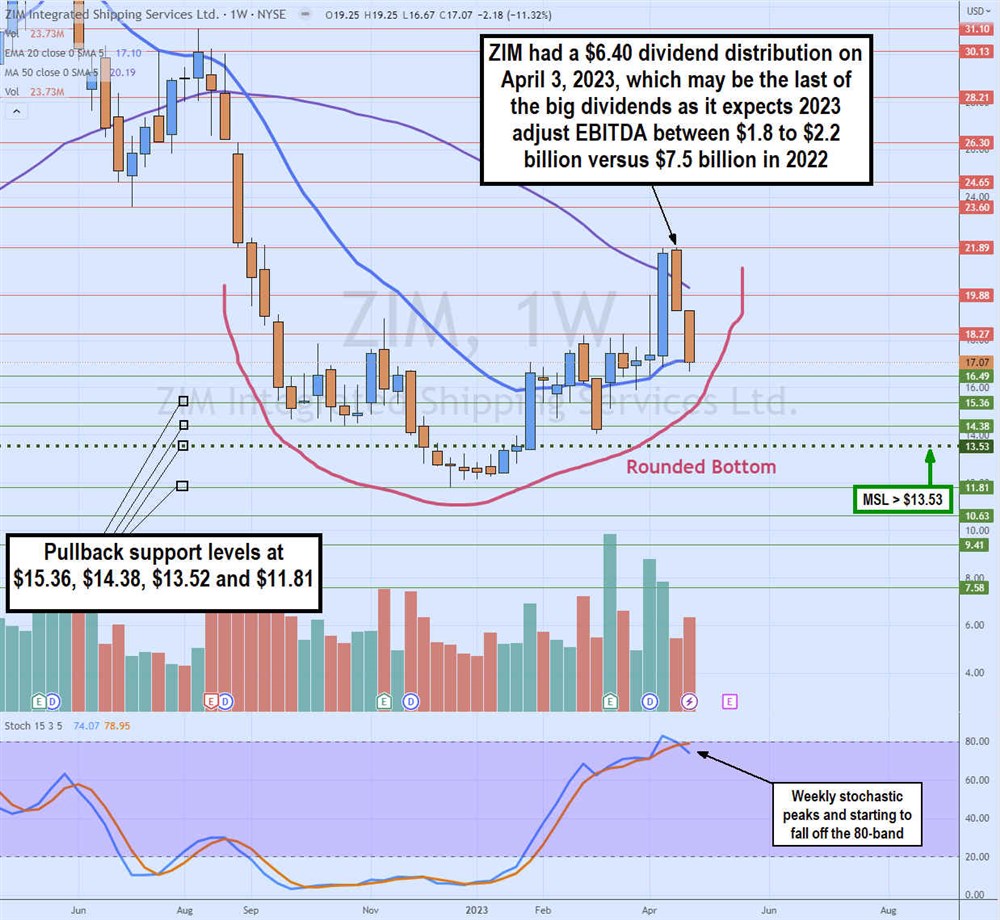
Weekly Rounded Bottom
The weekly candlestick chart on ZIM shows a weekly rounded bottom with its swing low at $11.81 occurring in December 2022. It's important to note that the $6.40 dividend payout on April 3, 2023, was the main reason for the stock to gap down over $6 from a closing price of $23.47 on April 2, 2023, as the market prices in the dividend amount. Shares fell to the weekly 20-period exponential moving average (EMA) support at $17.10 as resistance on the weekly 50-period MA at $20.19 continues to fall. The weekly stochastic peaked at the 80-band and has crossed down. This could set up pullbacks to support levels at $15.36, $14.38, $13.52 and $11.81.


