Apparel retailer Abercrombie & Fitch Co. (NYSE: ANF) shares soared over 30% on Q1 2023 earnings results. The company has come a long way since its past scandals involving discrimination, harassment, and environmental and animal cruelty violations. The NYSE: JWN">apparel retailer has transformed to rebuild its brand with its commitment to inclusion and diversity. It's finally paying off, as evidenced by the NYSE: JWN">reaction to its Q1 2023 earnings blowout and raised guidance. Falling freight and raw materials costs are a tailwind, but inventory reduction is crucial in combatting margin compression.
Is Margin Compression Finally Over?
High inventories leading to margin compression have been the bane of retailers, as echoed by Kohl’s Co. (NYSE: KSS), Nordstrom Inc. (NYSE: JWN), Target Co. (NYSE: TGT), and Walmart Inc. (NYSE: WMT). Apparel makers have been devastated by rising inventories compressing margins as heavy promotions were needed to move the merchandise. Due to macroeconomic uncertainty, consumers have pulled back their spending on discretionary goods like apparel. Consumer discretionary spending has shifted from goods to services, as evidenced by the robust demand for travel compared to the weakness in retail apparel. Abercrombie has bucked the trend.
Dressed to Impress
On May 24, 2023, Abercrombie released its first-quarter fiscal 2023 results for the quarter ending April 2023. The company reported earnings-per-share (EPS) of $0.39, excluding non-recurring items, versus consensus analyst estimates for a profit of 0.02, a $0.37 per share beat. Revenues grew 3% year-over-year (YoY) to $836 million, beating consensus analyst estimates of $814.93 million. Q1 2023 net sales beat a decade-long record, rising 14%. The gross profit rate was 61%, driven by a 570 bps rise, helping to drive operating margins above expectations.
AUR and Brand Sales
Average unit retail (AUR) rose 230 bps year-over-year, with price hikes. The AUR growth was partially offset by higher raw material costs of 320 bps and 100 bps from FX impact. Abercrombie brand sales rose 14% YoY to $436.04 million, accounting for 52% of total sales, while Hollister brand sales fell (7%) to $399.96 million. Inventories fell by (20%) YoY to $448 million. The company ended the quarter with $447 million in cash and equivalents. Total liquidity, including cash and ABL Facility, is around $758 million.
Abercrombie CEO Fran Horowitz commented, “Looking ahead, we remain cautiously optimistic on consumer demand and our ability to react to a dynamic macro environment, further supported by our strong balance sheet. We are managing inventory tightly, and each brand is in a position to chase demand. Importantly, we are progressing on key, strategic investments across stores, digital and technology to deliver growth on the top and bottom lines from 2022 levels consistent with our Always Forward Plan.”
Raising the Bar
Abercrombie raised its guidance for Q2 2023 for revenues to climb 4% to 6% or $837.2 million to $853.3 million versus $813.67 consensus analyst estimates. The company raised full-year 2023 revenue guidance by 2% to 4% or $3.77 billion to $3.85 billion versus $3.76 billion consensus analyst estimates. Operating margin is expected between 5% and 6%, up from 4% to 5% previously expected. It expects a 250 bps improvement over 2022 as freight and raw materials costs continue to fall. Capex is expected to cost around $160 million.
Weekly Descending Triangle Breakout
The weekly chart on ANF illustrates the descending triangle that formed upon peaking at $48.97 in November 2021. Each pullback to a lower low was met by the falling trendline making for lower highs on bounces. ANF formed a multi-week bottom of around $14.79 from September to October 2022. The weekly stochastic oscillated towards the 90-band as ANF staged a rally breaking out of the weekly descending triangle in January 2023. Shares surged towards a swing high of $31.69 in February 2023. Shares peaked and fell back to $21.74 in May 2023 as the weekly stochastic made another complete oscillation down to the 10-band.
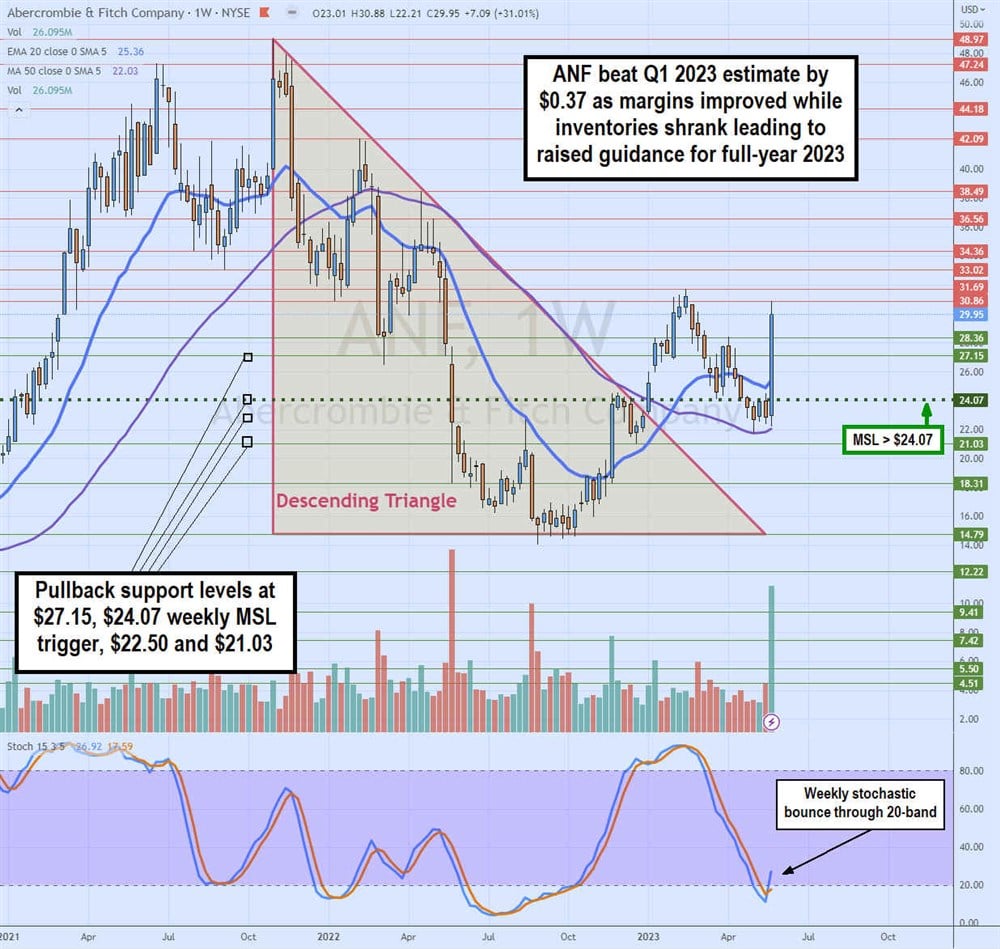
The weekly market structure low (MSL) buy triggered the $24.07 break. Its Q1 2023 earnings report spiked shares back towards the swing high area as the weekly stochastic stages another bounce up through the 20-band. The weekly 20-period exponential moving average (EMA) is rising support at $25.36, followed by the 50-period MA support at $22.03. Pullback support levels are $27.15, $24.07 weekly MSL trigger, $22.50 and $21.03.


