Jumia Technologies AG (NASDAQ: JMIA) stock has been selling off since peaking at $69.89 in February 2021. The company is like JD.com Inc. (NASDAQ: JD) or Amazon.com Inc. (NASDAQ: AMZN) of Africa. Its NASDAQ: AMZN">e-commerce platform and services accommodate 11 countries across Africa. Due to the rural nature of many regions, it's been a rocky ride for its logistics network. The company is shifting the concentration of products from large items like heavy appliances to smaller lightweight items like electronics, apparel, fashion, and beauty items.
The company has embarked on a turnaround strategy, reaping some results after seven months. Its secondary city strategy takes the Dollar General Co. (NYSE: DG) approach to embed itself in small towns as the de facto big fish in a small pond.
The Many Businesses of Jumia
Jumia operates many services through its platforms. Its electronic marketplace connects sellers with consumers very much like Amazon.com. It's been trying to expand its marketplace globally through its JumiaGlobal platform, which allows overseas sellers to also sell on Jumia. It offers its payment processing service called JumiaPay, similar to Alibaba Group Holding Limited (NASDAQ: BABA) AliPay. Its logistics service manages the delivery of packages to consumers and enables sellers to track the deliveries. Additional services include restaurant delivery, utility bill payments and airtime recharge. The company constantly faces challenges from e-commerce competitors, including Konga and Amazon. The logistics are challenging since much of Africa is not as developed, making delivering packages to rural areas expensive and inconvenient.
Turnaround Taking Shape
Jumia's turnaround strategy has been starting to show results as the company prioritizes cost-cutting and profitability measures over growth. Its Q1 2023 revenues fell 2.7% year-over-year (YoY) to $46.3 million. Active consumers and gross merchandise volume (GMV) fell (22%) YoY. However, the company also cut its losses by (54%) YoY, which is the lowest level in four years. The cost reduction initiatives are "bearing fruit," according to its CEO Francis Dufay. Fulfillment costs fell by (34%). Adjusted EBITDA loss is expected between ($100 million) to ($120 million) for full-year 2023. It's an improvement from the ($207 million) adjusted EBITDA losses in 2022.
CEO Insights
CEO Dufay commented on the new direction for Jumia on its path to profitability, "In the past, we allocated big numbers to promotions, customer incentives, Google, and Facebook. But that was too expensive. Now, we are focusing on long-term actions like building supply in key categories and extending to smaller cities.” He noted that secondary cities are a growth driver, as demonstrated by Jumia's proven success in the Ivory Coast. Jumia has become the leading e-commerce platform in the Ivory Coast. This serves as a template moving forward with the secondary cities.
Secondary City Strategy
Secondary cities have populations smaller than 100,000 residents. The populations have lower incomes and are less technologically inclined, but there is an undersell of demand for good quality and affordable products. These populations are not comfortable with digital platforms. Jumia establishes itself and embeds its technology into these secondary cities by building strong local teams comprised of JForce agents.
They form “pick-up” stations where locals can have JForce agents order items at the Jumia electronic marketplace. JForce agents introduce the technology and application of the Jumia app to get locals to accept it. As locals get acclimated to the service, they start to explore and eventually embrace the mobile app taking advantage of Jumia’s services. CEO Dufay stated, "I often read articles about there's no demand in Africa, or Africa is not ready for e-commerce. I wanted to clarify that there is demand, and it's in our hands to address it well."
The Dollar General Mini-Box Store Strategy
Over 87% of the customers surveyed at the pick-up stations were wholly satisfied and would reorder again, with Jumia citing cost savings for quality products. The secondary city strategy also helps keep global marketplace platforms like Amazon at bay due to the rural nature and lack of infrastructure to support the logistics. It's similar to the strategy of Dollar General, which specializes in opening mini-box stores in small towns with populations of less than 20,000. In contrast, big box stores like Walmart Inc. (NYSE: WMT) or Target Co. (NYSE: TGT) wouldn't waste time.
Jumia Technologies analyst ratings and price targets are at MarketBeat.
The definitive beginner’s guide to reading stock charts can be found free on Marketbeat.
Learn how to use the RSI indicator on MarketBeat.
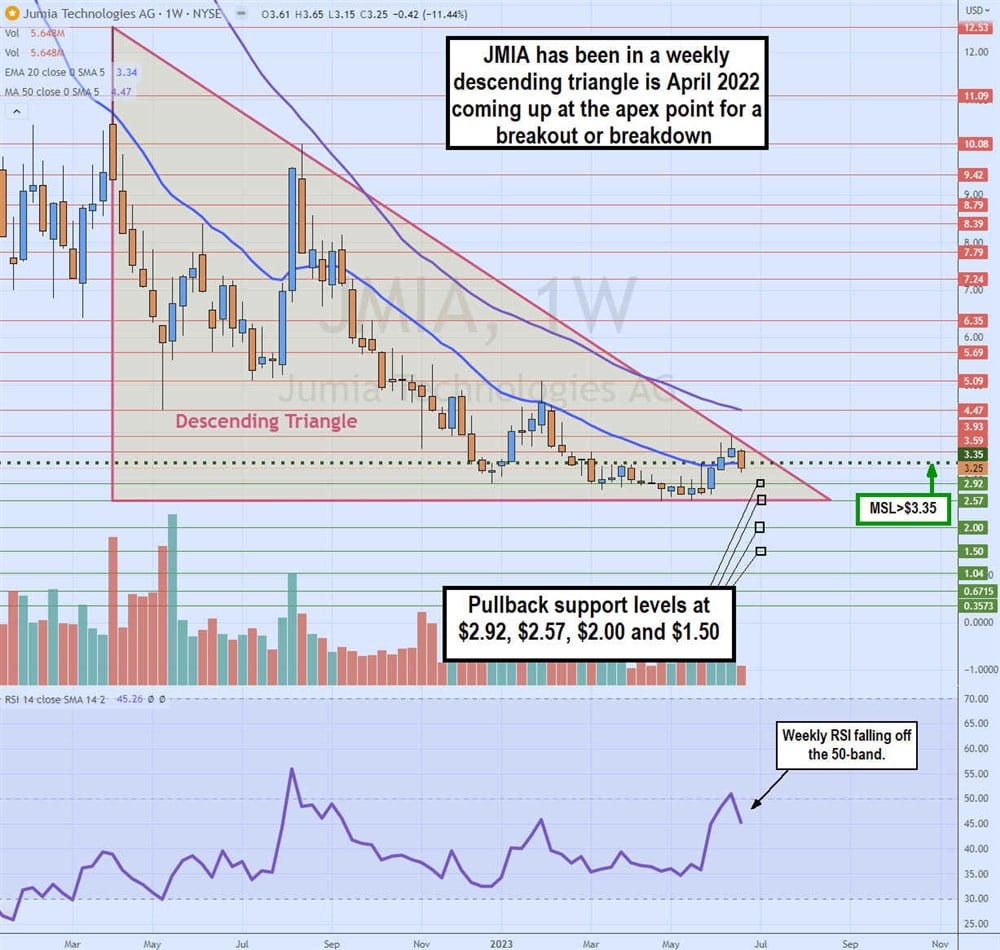
Weekly Descending Triangle
The weekly candlestick chart on JMIA illustrates a descending triangle formed after peaking at $12.53 in April 2022. Shares sold off, making lower highs and forming a descending trendline to the flat-top bottom trendline at $2.57 by April 2023.
The weekly market structure low (MSL) breakout through the $3.25 trigger attempted and failed to break the descending trendline as shares retested the weekly 20-period exponential moving average (EMA) at $3.34. The weekly RSI peaked and turned back down at the 50-band. With the apex point of the descending trendline and flat-bottom trendline nearing, JMIA is nearing a decision point to either breakout through the descending trendline or break down through the flat-bottom trendline.
Pullback support levels are at $2.92, $2.57, $2.00 and $1.50.