
Shares of Li Auto (NASDAQ: LI) have been on an impressive run lately, clocking in a 44.31% return YTD. What’s even more impressive is that LI has done so while shares of its main competitors, in the People’s Republic of China, BYD (OTCMKTS: BYDDF), XPeng (NYSE: XPEV), and NIO (NYSE: NIO) have lagged Li Auto, with returns of 28.21%, (15.09%) and (22.46%) respectively YTD.
Last year, China accounted for almost 60% of global electric vehicle sales. That same year, the market share of EV vehicles grew by a whopping 93% over the previous year. It is no secret that the growth of EVs in China is moving at an electric pace. As a result, many investors looking to gain exposure to the largest EV market in the world can do so right here on the two major U.S. stock exchanges, NYSE and NASDAQ, where shares of LI, XPEV, and NIO trade.
Li Auto is a Chinese company that, through its subsidiaries, designs, develops, and manufactures electric vehicles. Li also provides various services such as sales management, technology development, and equipment procurement. As of May 31, 2023, Li Auto had 314 retail stores in 124 cities, 319 servicing centers, and authorized body and paint shops in 222 cities. The company is headquartered in Beijing, China, and was founded in 2015.
Li Auto Announces Delivery Update for May
On June 1, Li Auto announced that they delivered 28,277 vehicles in May, up 10.1% from the previous month. That delivery figure represents a 146% increase over the same period in the prior year. This was the company’s third consecutive month delivering over 20,000 vehicles and its second month delivering over 10,000 Li 7s.
In May, XPeng announced 7,506 deliveries, up 6% from April. NIO announced 6,155 deliveries for the same period, down 7.6% from the previous month. In stark contrast, Chinese EV giant BYD sold 240,220 EVs in May, up 14.2% from April.
Company Earnings and Growth
Li Auto’s most recent earnings report was impressive, as the company continues to outsell its startup rivals Nio and Xpeng.
The company reported earnings of 20c per share on sales of $2.7 billion, with revenue almost doubling over the previous year. Li Auto noted that sales were 52,584 EVs for the first quarter, significantly outperforming Nio and Xpeng but behind the more established BYD.
For the second quarter, the company expects to deliver between 76,000-81,000 EVs, a significant increase year over year. Li Auto also sees second-quarter revenue at $3.53 billion - $3.77 billion, well above analyst estimates.
Analyst Ratings and Institutional Ownership
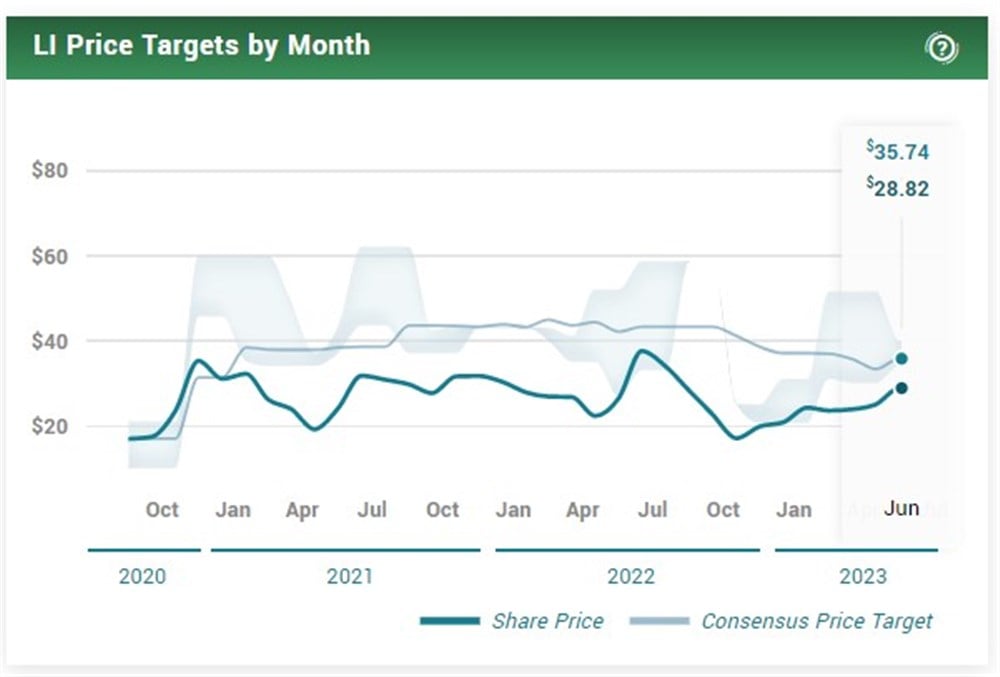
Li Auto is currently trading well below the consensus analyst price target of $35.74, which implies a 21.39% upside for shares of the company. The company has a Buy rating based on six analyst ratings, all of which are Buy. The high prediction is $51.50, while the low forecast is $20.66.
The current institutional ownership is modest at 20.97%. However, in the previous 12 months, total institutional inflows have been $1.63 billion versus outflows of $1.10 billion. In the first quarter of 2023, net institutional inflows were $91 million.
Should You Consider Investing in Li Auto?
Li Auto’s impressive performance compared to its Chinese competitors certainly build a strong case for investors looking to gain exposure to the EV market in China. Li Auto's shares have increased by an impressive 44.31% YTD and displayed significant relative strength to its peers. At the same time, the stock continues to base over previous resistance and remains attractive from a technical analysis point of view.
Li Auto has also demonstrated strong and consistent delivery figures, earnings growth, and positive analyst ratings, making the Chinese EV maker an attractive investment opportunity.


