Unity Software (NYSE: U) broke above a critical resistance level last week. The stock, now up 55% year-to-date, looks set to continue its impressive momentum on the year after last week's action. Despite pulling back over 5% on Friday, U still closed above the previous resistance, indicating that resistance may have turned into support. However, the sharp pullback on Friday, just a day after breaking out, might leave investors wondering if a false breakout occurred in the stock.
Unity is a game development platform that allows users to create and build interactive 2-D and 3-D environments for gaming and other applications. Unity was one of the first developers to fully support the iPhone operating system, making it a go-to choice for game developers.
Over the years, Unity has expanded its offerings to include desktop, mobile, tablets, consoles, 3-D, web-based, and virtual reality platforms.
The Price Action In Unity
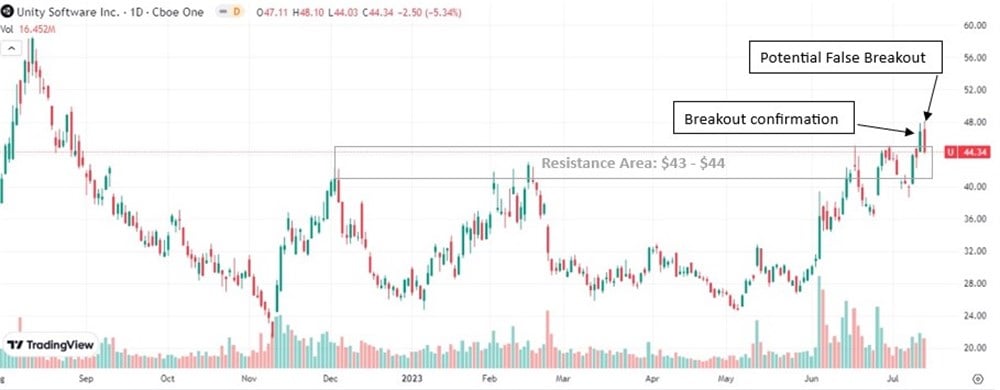
Since the end of last year, $43 to $44 has acted as a critical area of resistance for U. In late November of last year and February of this year, shares tested this level but failed to hold above. More recently, after making multiple attempts in June and early July, the stock broke above this area of resistance and notably closed above on Thursday.
Despite pulling back 5% on Friday, along with the overall market, shares of U still closed above the critical level of $44.
While the stock was able to close above the previous resistance, the selling on Friday opened the door for a potential false breakout. If the stock trades back into the range and under $44, then a false breakout might be confirmed, and a further move lower would be likely.
However, if the stock can find support over $44, and turn previous resistance into support, a move towards last week's high near $48 could be a likely short-term target. The upcoming action this week will be vital to determine whether or not the breakout will have momentum.
Analysts Predict Downside
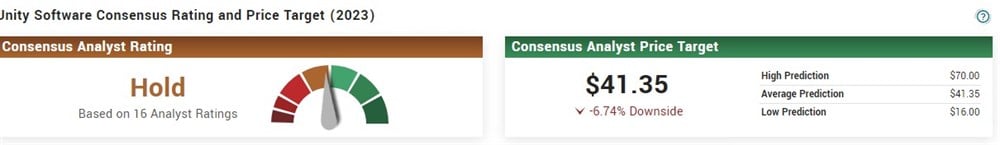
Analysts are currently predicting a downside for U, with the consensus price target of $41.35, predicting a 6.74% downside for the stock. Based on the 16 analyst ratings, the consensus rating is Hold. Month over month, the consensus price target has risen from $40.06 to $41.35. Most recently, on July 12, Barclays boosted their price target from $31 to $40. Of the 16 analyst ratings, 8 have U as a Buy, 7 as a Hold, and 1 as a Sell.
Insiders Are Selling Unity Software
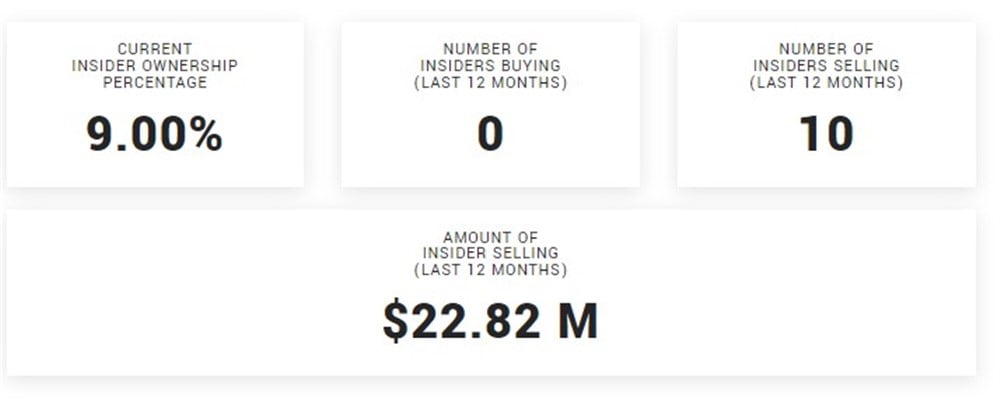
Despite the positive momentum in shares this year and the NYSE: U">partnership with Apple (NASDAQ: AAPL) for the Apple Vision Pro headset, insiders have consistently sold stock each quarter so far this year. Over the last twelve months, the total amount of insider selling is $22.82 million, comprised of ten insiders. Over the same period, there have been no insider purchases.
Should You Invest In Unity Software?
Unity has shown impressive performance lately in the market, with the stock up close to 10% last week despite Friday's selloff and 55% YTD. However, Friday's selloff cast doubts over Thursday's breakout and whether the breakout will continue to the upside. The upcoming week will be important for the stock and specifically to note whether U can hold above the previous resistance.
Will the analysts be correct in predicting the downside, or will the stock hold over $44 and continue to trend higher into earnings? Unity is set to report earnings on August 2, after the market close.