As the overall market reached new 52-week highs this week, consider making a shortlist of stocks consolidating near resistance levels. These stocks could present potential breakout opportunities. In a bullish market environment, where sectors and stocks are trending higher, it is prudent to identify stocks with a high risk-to-reward ratio, trading close to key resistance levels and showing signs of a potential breakout.
Hewlett Packard Enterprise (NYSE: HPE) is a stock currently trading near its 52-week high and a significant resistance level established in 2018. This presents a unique opportunity for an explosive upward move if the stock can break through the barrier on increased trading volume, indicating a possible significant sentiment and momentum shift for HPE.
Hewlett Packard Enterprise Company offers data solutions across various regions, including the Americas, Europe, the Middle East, Africa, the Asia Pacific, and Japan. The company operates in six segments: Compute, HPC & AI, Storage, Intelligent Edge, Financial Services, Corporate Investments, and Other. These segments cater to customers by enabling them to capture, analyze, and utilize data seamlessly. The company was founded in 1939 and is headquartered in Spring, Texas.
The Bigger Picture
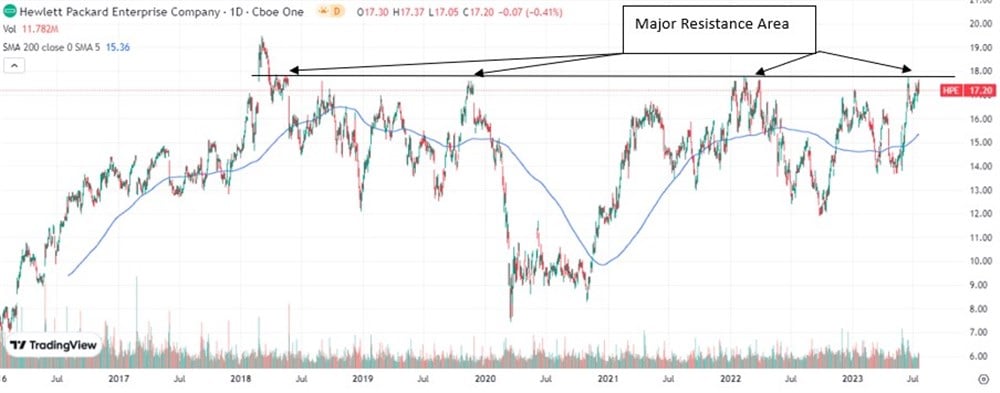
In the above daily chart of HPE, the crucial resistance zone is evident, ranging from $17.5 to $18. Since 2018, every attempt by the stock to surpass this zone has resulted in selling pressure and subsequent failure. Given the numerous tests over the years, this area has become a significant breakout level, which could gain substantial momentum if buyers manage to assert control above the $18 mark.
A Closer Look
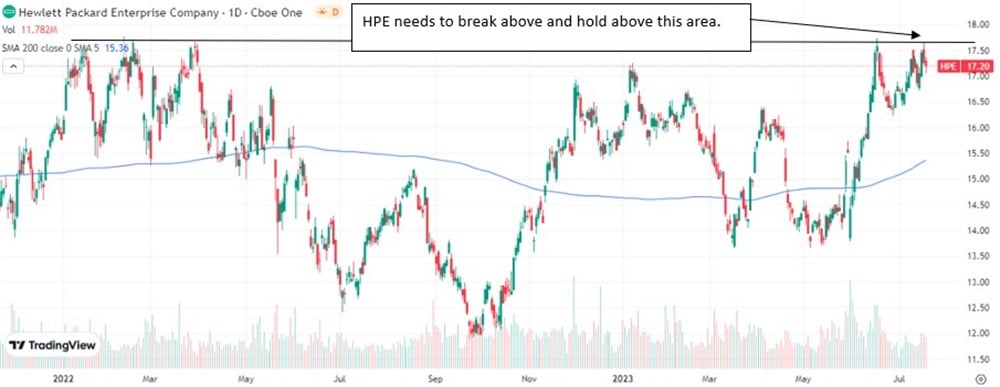
Zooming in on the chart, it's evident that for the breakout to gain momentum, HPE must first break and sustain above the $17.50 level. This level represents the initial hurdle the stock needs to overcome. Once that is achieved, the next crucial test lies at $18. Successful consolidation above $17.50 and a clear break above $18, supported by increased trading volume and buyer interest, would confirm the breakout. If these conditions are met and the price stabilizes above the previous resistance, HPE could experience substantial upward momentum.
What Do Analysts Think?
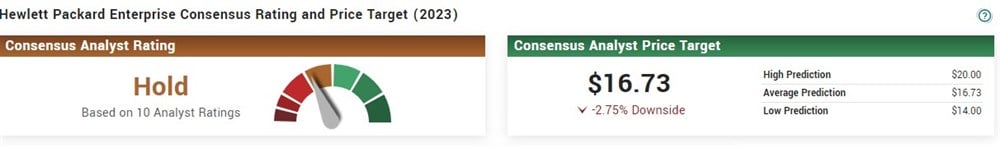
Analysts see a potential downside in the stock with an average price target of $16.73, predicting a minor 2.75% downside. Based on the ten analyst ratings, two have the stock at Buy, seven as Hold, and one as a Sell. The consensus analyst rating on HPE is Hold.
Institutional and Insider Activity
Institutions appear to like the stock, with the current institutional ownership at 81.69%. Total institutional inflows over the previous twelve months have been $2.25 billion, compared to $1.7 billion in outflows.
However, it's a different picture when it comes to insider activity. Over the previous twelve months, insiders have sold $24.54 million in HPE stock. During the same period, no insiders have purchased stock.
Should You Invest?
The breakout pattern in HPE appears promising, from a technical analysis standpoint, with a critical resistance zone identified around $17.50 - $18. However, it is essential to exercise caution as this only sometimes translates to a favorable investment opportunity.
Before considering a trade, investors should closely monitor whether the stock successfully breaks out above $18 and finds support above this level, as meeting these conditions will be crucial for a potential investment or trade decision.


