Levi’s (NYSE: LEVI) shares are down more than 7% in premarket trading after the company issued weaker-than-expected guidance. The guidance calls for significant improvement in the second half but fell short of the analysts' expectations. That led to several price target reductions weighing on the price action, but the downtrend is over.
Levi’s outlook confirms the whisper numbers, which were and are expecting consumer spending to slow in the 2nd half. The takeaway for investors is that Levi’s, with its iconic brand and lean into DTC, is among the best-positioned apparel manufacturers in the industry, and it has solid cash flow and a healthy balance sheet to sustain its high-yielding dividend.
Levi’s didn’t make much money in Q2, but free cash flow is trending positive, and the company is guiding for improved profitability in the 2nd half. The point is that cash flow is sufficient to sustain operations and pay dividends with little fear of a distribution cut or suspension.
Regarding earnings, the company is paying only 44% of its adjusted EPS guidance at the low end of the range. That is a manageable number and compounded by the low leverage ratio. Leverage increased during the quarter but is running very low at only 1.6X equity, and there is ample cash on the balance sheet.
The balance sheet carries $472 million in cash, up from last year due to inventory actions, which is enough to pay the dividend for several years. The bottom line is that Levi’s is a value play trading below 12X earnings and pays a solid dividend.
Levi’s Has Weak 2nd Quarter: DTC Shines
Levi’s had a tepid 2nd quarter, but the weakness is centered in a single channel, and there is a mitigating factor that takes some of the sting out of the news. The weak channel is Wholesale, and the mitigating factor is the ERP shift that sapped 700 basis points from the results. The company reported $1.34 billion in net revenue, a decline of 8.8% compared to last year. That is as expected and comes with a better-than-expected margin.
Americas led the decline regionally with a contraction of 22% led by Wholesale. Asia was the best-performing region, led by China, growing 27% on an FXN basis and 18% as reported. DTC, the company’s growth channel, expanded by 13%, with strength in stores compounded by a 20% increase in digital.
The margin news is mixed, but the bottom-line results favor shareholders. The gross margin improved by 60 basis points on pricing and mix-shift and was only partially offset by higher costs. SG&A expenses increased compared to last year, but much of that increase is 1-off items related to ad-spend, anniversary celebrations for the core product line, and investment in the future.
The result is GAAP earnings of $0.00 and adjusted EPS of $0.04, which beat the consensus by $0.01 or 2500 basis points.
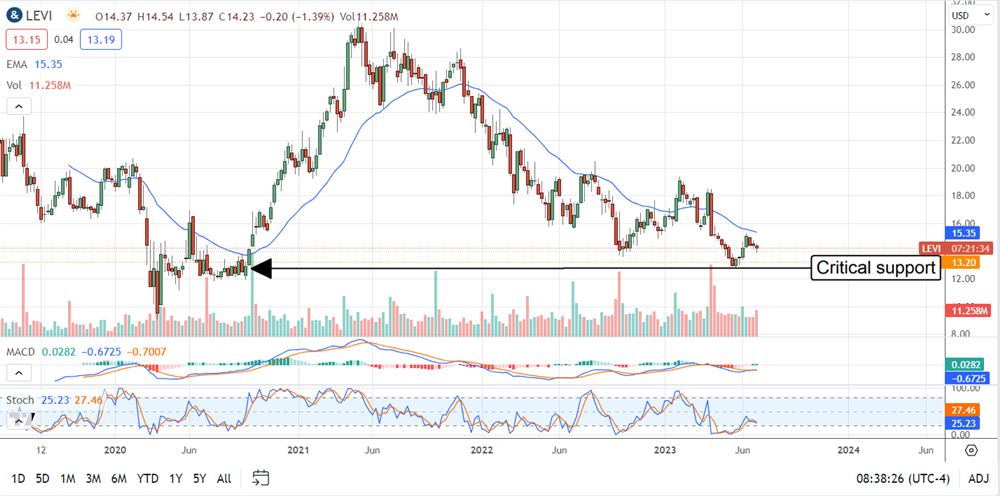
The Sell-Side Signals A Bottom
The analyst are lowering their price targets, but the trend in sentiment, the price targets, and the institutional activity suggest a bottom is at hand. Marketbeat picked up 3 new price targets following the release, dragging the consensus target lower. The consensus is near $18.50, which implies a 30% upside relative to the pre-release closing price and the new low target, set following the release, assumes the stock is under-valued at $13.
On the institutional end, they own a small 20% of the company but have been buying on balance at a rate of 3:2, and their activity ramped in the 2nd quarter of 2023, consistent with bottoming action on the charts.
The chart action is at a critical turning point. The market fell more than 7% on the guidance reduction and is trading near recent lows. Those lows are consistent with prior support and should produce a solid bounce but may not. If the market can not hold this level, shares of Levi’s could fall to $10 or lower, where they would become an even more attractive buy.