The Q2 results from Dick’s Sporting Goods (NYSE: DKS) have it and other sporting goods names moving lower but don’t read too much into the move. Dick’s results were deeply impacted by shrinkage, which is a growing problem for the entire industry. Target (NYSE: TGT), another big name suffering from shrinkage, also offers value but is in a less-solid position regarding its long-term outlook. The point is that Dick’s is down on a problem it can solve.
Shrinkage is a problem now and will impact the company this year, but once the high-risk items are identified, they can be mitigated. Shrinkage won’t go away, but neither will the sporting goods industry because we love sports. When it comes to quality products you want to use, you can’t buy them at Walmart (NYSE: WMT) or a discount store (usually); you have to go to a specialty retailer with the gear used by winners.
To put this opportunity into dollar values, the US sporting goods industry is valued at over $137 billion in 2022 and expected to grow at a nearly 9% CAGR through 2023 at least.
Foul On The Play, Dick’s Hit By Theft
Dick’s had a tough quarter, but once you dig into the detail, you realize the biggest problem, perhaps the only problem, is theft. If not for that, the other metrics make DKS shares a buy and may have sent the market to a new high. In contrast, the adjusted $2.82 in EPS fell 23% compared to last year and missed the consensus by a dollar, but revenue grew and aligned with consensus on an increase in comps and new stores.
Comps grew by 1.8% on a 2.8% increase in transactions and an increase in market share; the company added 7 new stores and said the new, larger concepts are performing well.
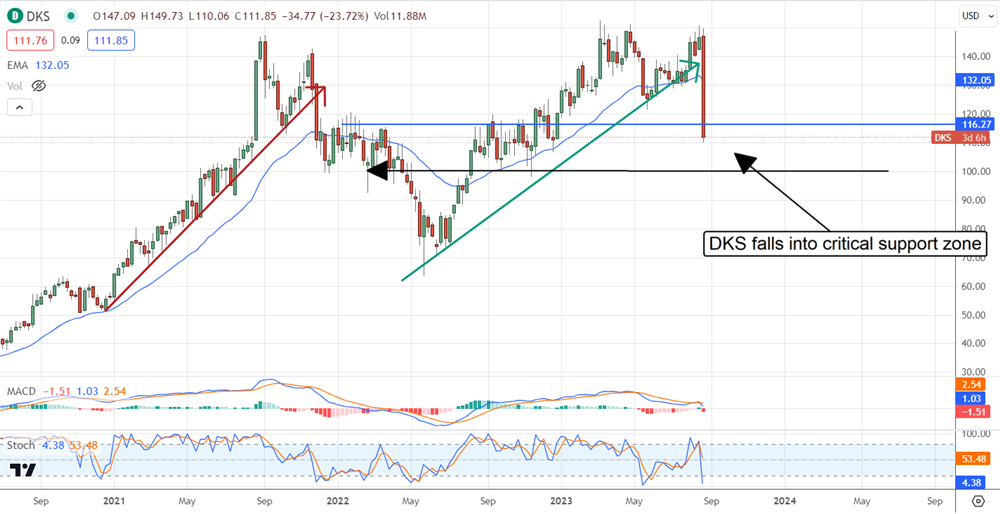
Dick’s Sporting Goods is emerging, again, as a high-yielding value for income investors. The stock trades at less than 11X its earnings compared to other major retailers, which command higher valuations. The stock pays more than 3.5% in yield with the shares at their new lows, and the payout is reliably safe. The company issued the Q3 declaration minutes before the Q2 EPS report at the expected level, and the balance sheet is in fine shape. Some details from the Q2 report include an increase in cash, a reduction in inventory, and a debt reduction, which all play into the long-term outlook. That includes sustained annual dividend increases.
Academy Sports + Outdoors: Set Up For A Fall?
Academy Sports + Outdoors (NASDAQ: ASO) has been tracking in relative alignment with DKS shares for the last several years and is moving lower on DKS results. The difference is that ASO hasn’t reported for Q2 yet and may have further to fall. The difference is that weakness is already priced into ASO results, suggesting a bottom could already be in play.
Academy had a tougher Q1 than Dick’s, as seen in the share prices. High inflation and poor weather in its key western markets cut into top and bottom-line results. However, the guidance was favorable and suggested improvement in the back half that could appear in the Q2 results. The question is how shrinkage plays into the picture.
Academy also has a solid dividend outlook to entice investors. It pays a much lower 0.6% yield, but you can buy it at a cheaper 8X earnings. Another attraction of the dividend is the payout ratio and CAGR. The company pays less than 5% of its earnings outlook, and its first distribution increase was worth 20%.
For investors interested in parking money and building a long-term position in a cash-generating dividend-compounding machine, Academy could deliver triple-digit total returns over the next decade driven by growth, dividends, dividend growth, and a price-multiple expansion.
Shares of ASO fell more than 5.0% on DKS weakness, but signs of a bottom are already appearing. The market bounced from critical support at the $50.65 level, coinciding with a prior high. The market may retest this level before the Q2 release and fall through if shrinkage is bad, but the long-term outlook for sporting goods remains positive.