Dividend Kings are attractive for risk-averse income investors and many other investment strategies. They have sustained and sustainable dividend growth and a relatively high yield compared to the average S&P 500 company. The higher the yield, the better, in most cases, but a high yield can sometimes be a red flag. A high yield can be a function of a declining share price, which begs the question of what’s wrong.
Looking at the Dividend Kings from a Dogs-of-the-Dow style approach, many stocks in the group are down simply because they are out of favor and could easily rebound over the coming year. This is a quick look at the 6 highest-yielding Dividend Kings, stocks that all yield more than 3.5%, to see which ones are set up to deliver a share price increase on top of a group-leading dividend.
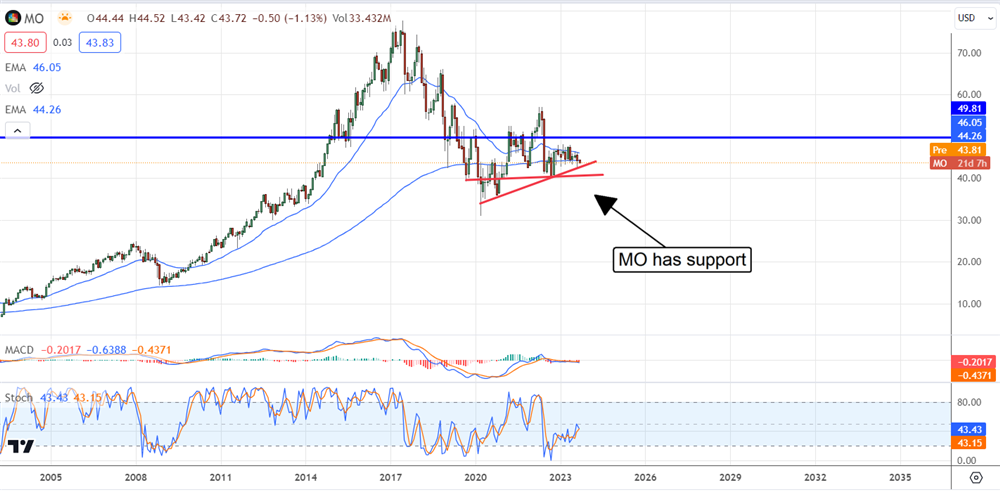
Altria Yields 8.6% and Is Cheap to Buy
Altria (NYSE: MO) is the highest-yielding Dividend King, with a payout worth more than 8.5% in late 2023. That yield is partly due to a share price decline and its 50+ years of consecutive annual increases. The payout ratio is a bit high, near 80%, but is offset by a healthy balance sheet, pricing power, margin improvement, and outlook for EPS growth next year.
The stock trades at a low 8.75X its earnings, which is another bonus, and there are signs of stabilization within the market. Shares are down roughly 40% from the 2017 peak but show rising support at long-term lows. Analysts hold it and see the market moving about 8% to 10% higher.
3M: Rounding a Corner and Heading Higher
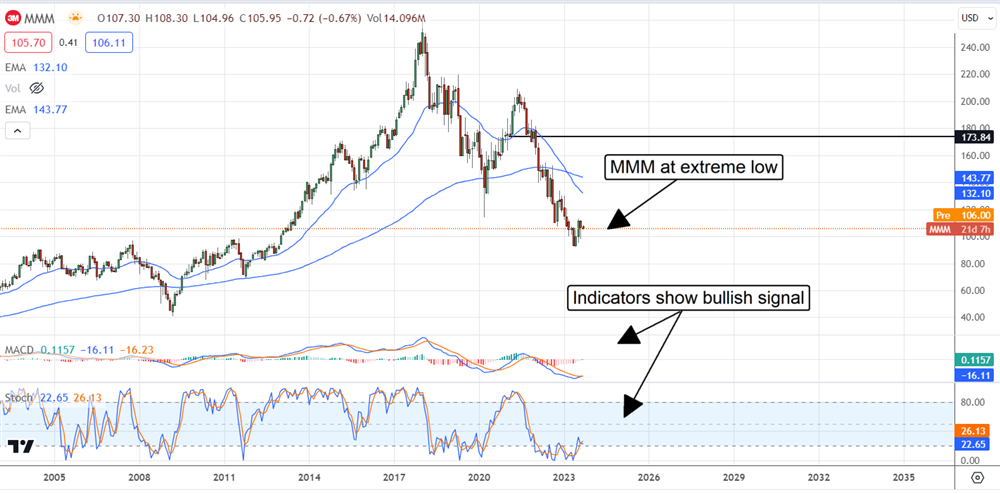
3M (NYSE: MMM) recently announced settlements for a major class-action lawsuit, greatly improving the outlook. The company’s board ratified a settlement to pay $6 billion to veterans with hearing loss related to its earplugs. The deal faces some headwinds; there is a chance that enough veterans will refuse to accept, but it appears the worst is behind the company.
The analysts have been upgrading and raising price targets since the announcement, and their activity is consistent with a bottom in price action. The dividend is a factor, worth 5.65%, with shares trading near $105 and growing. The company has sufficient capital and cash flow to continue increasing at a low-single-digit pace, but there is some risk. The company may have to lean into debt to handle the settlements, which is not a serious threat now.
Northwest Natural Holdings: A King of Utility Companies
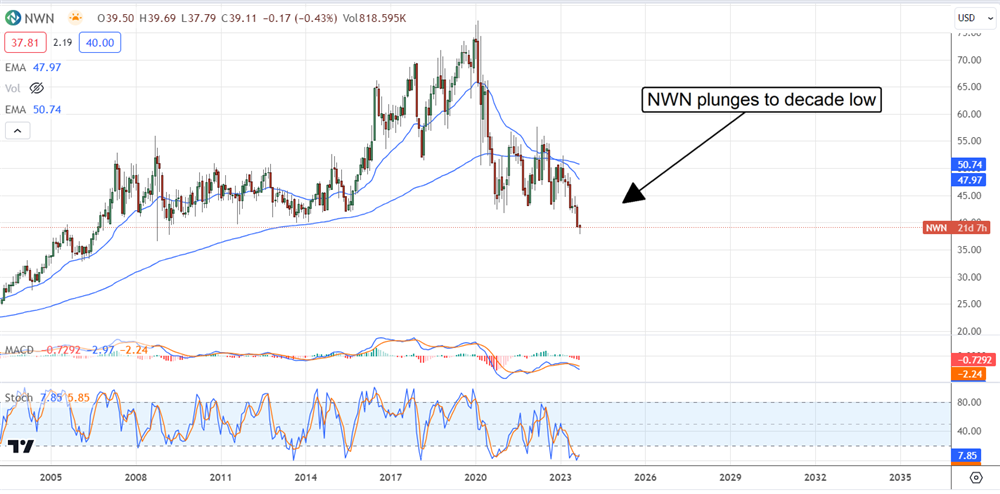
Northwest Natural Holdings (NYSE: NWN) is a small natural gas utility in the Pacific Northwest. It yields about 5% and has increased its payout for over 60 years. The pace of increase is low, and the payout ratio is high, but a growth outlook supports both. The company recently announced plans to improve its diversification with a biogas operation and expanding territory that should sustain growth, if not at the high double-digit pace of the last few years. Analysts rate the stock a Hold and see it trading 7.5% higher at the low end of their range.
Federal Realty Investment Trust: The Best Way to Play Retail?
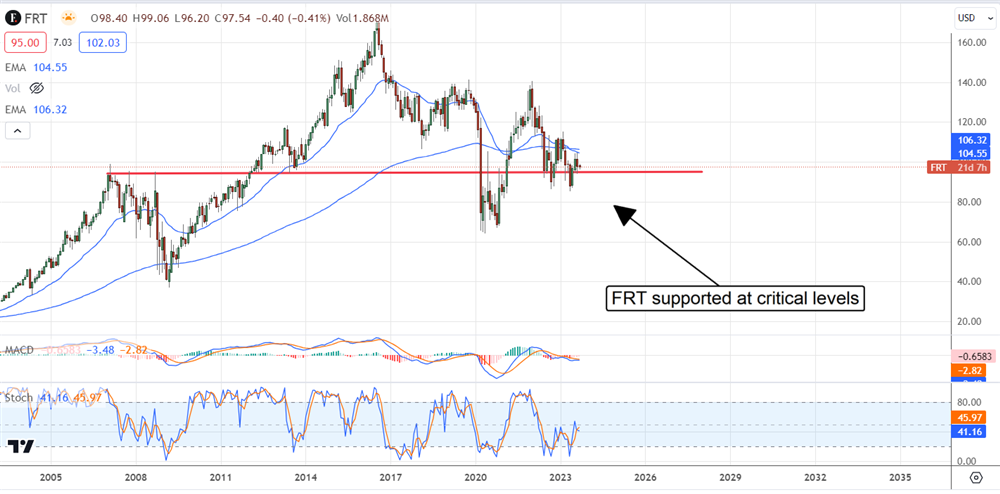
Federal Realty Investment Trust (NYSE: FRT) is a REIT specializing in high-quality, mixed-use retail communities in major markets across the US. It focuses on underserved, high-demand areas, targeting high-quality retailers and long-term contracts. It yields about 4.45%, with share trading near a 2-year low and above critical support. The analysts rate this stock a Moderate Buy and see it trading about 5.5% higher at the low end of the range.
Target: A Contrarian Play On Retail
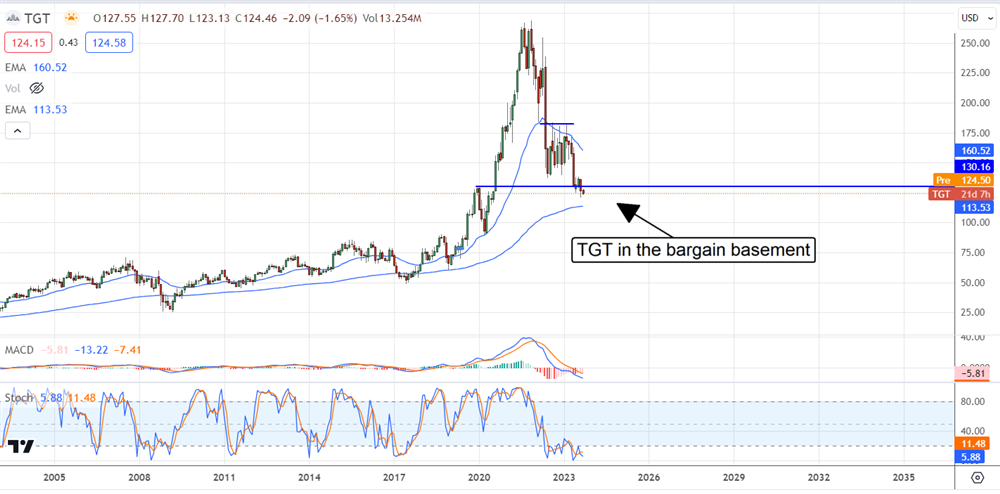
Target (NYSE: TGT) shares are down for a reason but may have reached their bottom. The reason is a lack of relevance in today’s environment, but this problem can be fixed and is being worked on. Regarding the dividend, the stock pays a little more than 3.5%, with shares trading near multi-year lows and offers a discount and yield not seen in years. The risk is that share prices may suffer in the near term; the opportunity is that the dividend is reliable and growth sustainable while the company affects turnaround.
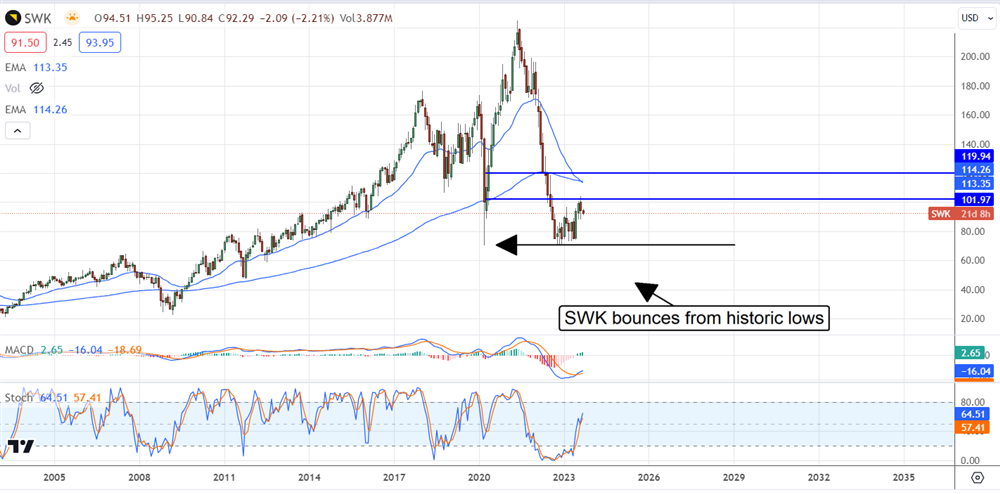
Stanley Black & Decker: Industrial Strength Dividends at Rock Bottom Prices
Stanley Black & Decker (NYSE: SWK) shares are down more than 60% from their peak and may fall further. The company is struggling with profitability, although there is an expectation for a significant rebound in earnings next year. The risk with this 1 is that payouts are well above the annual EPS outlook and strain the balance sheet. The company should be able to sustain payment and growth until earnings improve.