![]()
One stock in particular that has displayed impressive relative strength in recent days compared to the overall market and its sector is Akamai Technologies (NASDAQ: AKAM).
While the overall market, SPDR S&P 500 ETF Trust (NYSE: SPY), is down close to 4% on the week so far, shares of AKAM are up nearly 3%, displaying a solid ability to buck the overall trend.
Not only has AKAM outperformed in the short-term, but from a technical analysis point of view, the stock just broke out of a consolidation, signaling that outperformance and upward momentum might continue in the medium term.
Given its short-term standout performance and bullish technical setup, a closer look at the technicals and how analysts value the stock could be beneficial.
Akamai Technologies (NASDAQ: AKAM)
Akamai Technologies is a cloud services provider based in the United States specializing in securing, delivering, and optimizing content, applications, and software globally. They offer solutions for web and mobile performance, media delivery (including video streaming), and cloud computing, encompassing services like computing, storage, networking, and database management.
AKAM has a P/E ratio of 36.46 and a market capitalization of $16.37 billion, classifying itself as a mid-cap. The stock currently has a short interest of 5.3% and an average daily volume of 1.6 million shares.
The company reported its most recent earnings data on August 8, 2023. For the second quarter, AKAM posted $1.01 per share earnings, falling short of the consensus estimate of $1.11 by $0.10. They generated $935.72 million in revenue for the same period, slightly surpassing analysts' expectations of $931.52 million.
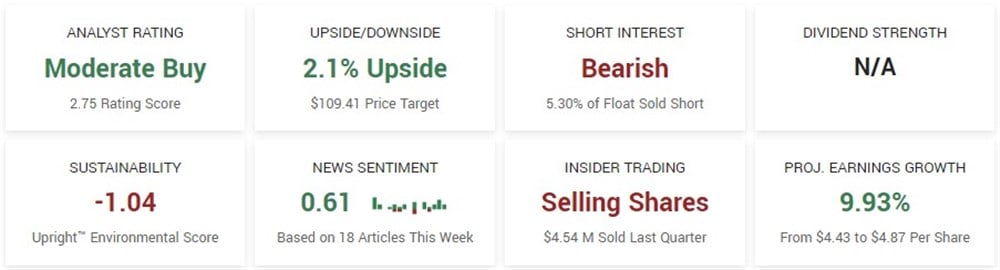
Looking ahead, AKAM is expected to experience earnings growth of 9.93% in the coming year, with earnings per share projected to increase from $4.43 to $4.87.
A Closer Look at Analysts and Institutional Involvement
Analysts are bullish on shares of AKAM, with a consensus rating of Moderate Buy based on sixteen analyst ratings. Of the sixteen ratings, one is a strong buy, and eleven are a buy. The consensus analyst price target is $109.4, almost in line with the stock's recent close. Most recently, Tigress Financial reiterated its rating on AKAM as a strong buy and price target of $132, predicting over 23% upside.
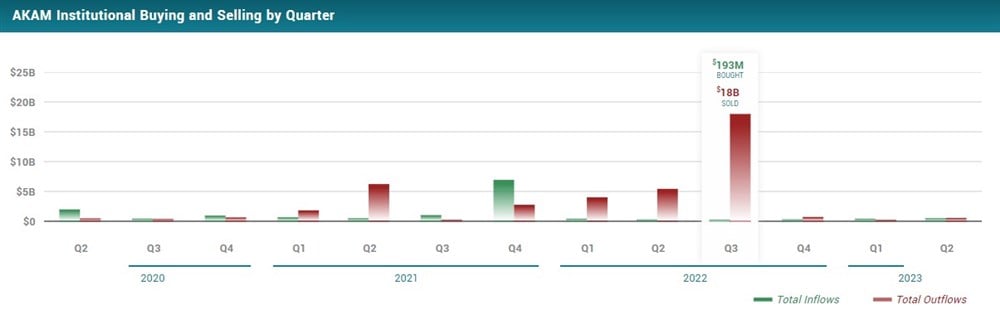
Over the previous three quarters, institutions have been relatively quiet in their activity in AKAM. However, over the past twelve months, institutional outflows have greatly exceeded inflows. The stock has experienced $19.27 billion in institutional outflows compared to just $1.25 billion in inflows during the same period. Currently, AKAM has 91.4% institutional ownership.
Technical Analysis of AKAM
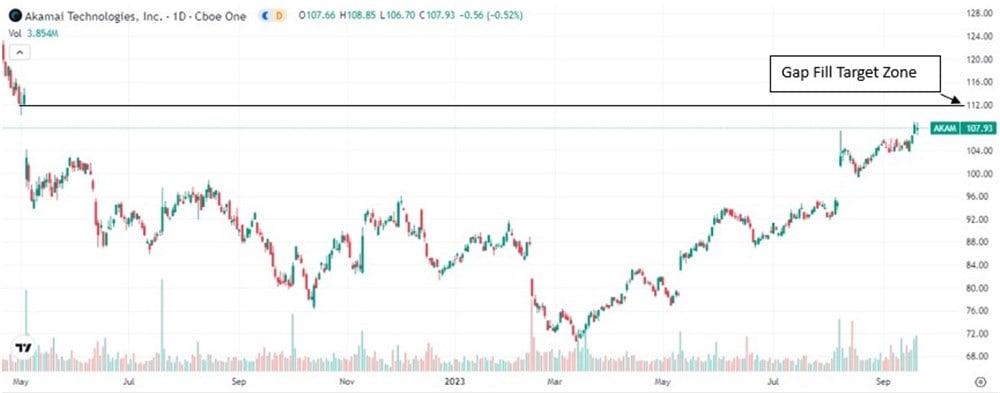
AKAM has held a firm uptrend for most of the year, now up almost 29% year-to-date. After consolidating for several weeks above $104, with $106 serving as resistance, the stock broke out on Wednesday. Notably, the stock broke out of its consolidation while the overall market experienced weakness.
Going forward, if AKAM can continue to display relative strength and experience sustained volume above the previous resistance of $106, then a move toward $112 and gap fill could be a potential target in the near term.