If you’ve been wondering when Lucid Motor's (NASDAQ: LCID) downtrend will resume and how deep the stock price can go, the answers are soon and much deeper. The latest news is more of the same as what was issued earlier in the year, resulting in increased dilution and reduced investor confidence. The news is the public offering of 262,000,000 million shares and an offsetting issuance to Lucid’s largest shareholder. That’s worth another 375,000,000 shares and sufficient to dilute shares by 30%. The critical takeaways are that this cash will be burned like so much has been burned before it, used for “general corporate” purposes, i.e., the high cost of developing, ramping production, and marketing its electric vehicles.
Lucid on Track to Produce Losses in Q3
Lucid’s Q3 production and delivery numbers were not impressive. Although automobile deliveries ramped higher, the increase is unsustainable due to the sequential decline in production. The company produced only 1,805 vehicles, missing the consensus by more than 450 or nearly 20%. The Q3 results will be released in early November; analysts forecast a sequential decline in revenue to $195.2 million, up 30% compared to last year, and for losses to widen. There is a chance for outperformance due to the low bar set by analysts and strength in deliveries, but it will likely be insufficient to sustain upward movement in the share price.
Other than the Saudi PIF, which is invested heavily in Lucid’s success, owning about 58% of the stock, the sell-side support is shaky at best. MarketBeat data shows institutional ownership at only 11%, with analysts reducing their sentiment ratings and price targets in 2024. The trend in sentiment revisions has the consensus at Hold verging on Reduce with a price target of $3.70. The $3.70 target implies a 40% upside from recent action but is well below critical resistance points and down by 50% in the last 12 months. That trend is not expected to end until there is a clear path to profitability; profitability isn’t expected until 2027, and the forecasts are dimming.
Lucid’s Dilutive Actions Play Into the Hands of Short-Sellers
The short interest in Lucid stock is down from its highs in 2021 but remains high at nearly 30%. Because there have been no bullish catalysts and the share sales are a dilutive influence, investors should expect the short interest to remain high for the foreseeable future, if not increase. Other reasons to expect Lucid’s short interest to remain high include stalled growth, lack of profits, and the incredibly high valuation. The stock trades at 10x this year’s sales, a nearly 50% higher valuation than Tesla, which makes money.
Among the risks for investors in Q4 is the outlook for 2025. The analysts' consensus forecast reported by MarketBeat implies a 130% increase in sales that may not become a reality. The forecast for 2025 hinges on three things: the ramp of Lucid Air production, the start of production for Lucid’s Gravity SUV model, and competition. As it is, Air production growth is underwhelming, Gravity has yet to be released, and competition is growing. Although the major OEMs have scaled back their EV plans, production is accelerating in 2025, including numerous offerings to compete directly with Lucid’s higher-priced vehicles.
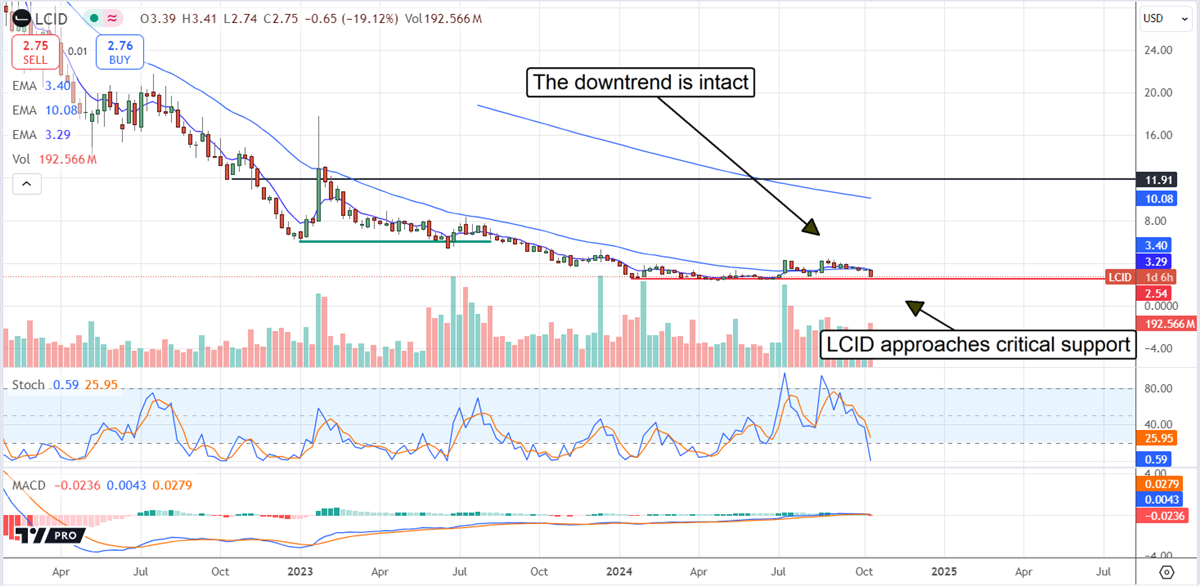
The Technical Outlook for Lucid Stock Is Bearish
The technical outlook for Lucid’s stock is bearish because it is in a downtrend, and the trend is intact. The share sale news sparked a 15% decline in the market, putting the stock at a multi-month low, below a critical support target. That target is near $2.80, and lows set in August when the Q2 results were released. Assuming the market cannot close above that level, it will likely continue to the bottom of the long-term range. The bottom of the long-term range is near $2.50; a move below it would open the door to a significant decline that could lead this stock into the $1.00 range.