MarketBeat.com offers numerous tools to investors, but the single most significant is the MarketRank™ tool. The MarketRank feature aggregates data for over 1.5 million global listings in eight categories and ranks them accordingly. The overall score runs from a low of one to a high of five, meaning a Five Star stock ranks within the top 1%, making it a high-probability target for long-term-oriented investors. Analysts' sentiment, news sentiment, ownership, short interest, earnings, and valuation are among the categories tracked. This is a look at the top three names heading into October.
Schlumberger Is the Number One Pick For October Investors
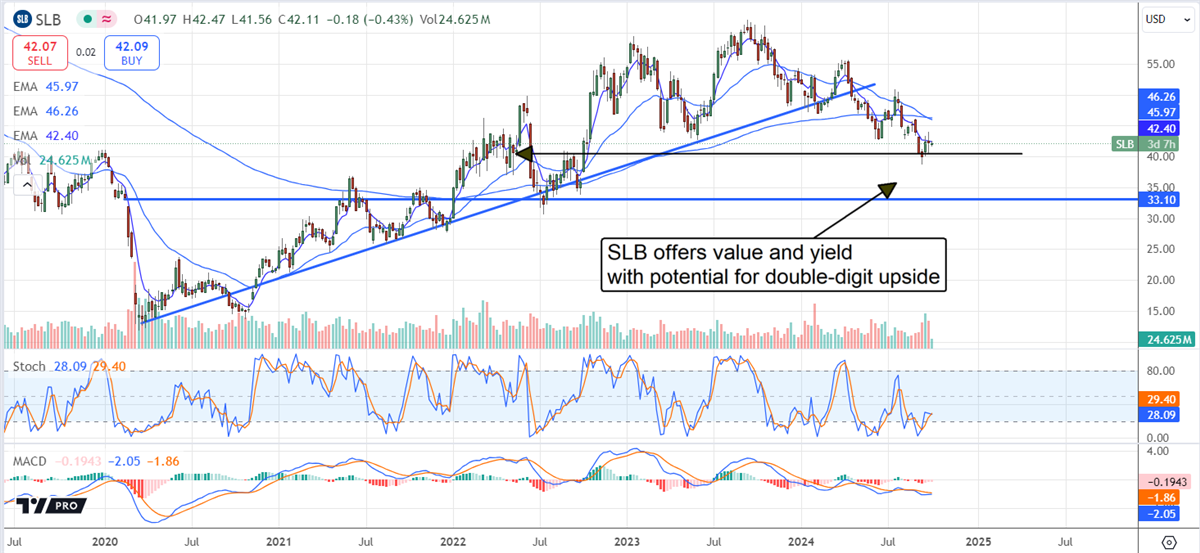
Texas-based Schlumberger (NYSE: SLB) is the world’s largest oilfield services company, offering various services, including reserve management, production, and digitization. The company and the industry are supported by a super-cycle driven by years of underinvestment leading into the post-pandemic era and the need for modernization and efficiency.
Results in 2024 include sustained double-digit top-line growth, margin expansion, and robust cash flow to support its dividend. Schlumberger is well-regarded as a dividend growth stock with the potential to sustain distribution growth indefinitely due to the low payout ratio, cash flow, and balance sheet. The stock yields about 2.6%, with shares trading near a two-year low, providing a value-based entry point for dividend growth investors.
Analyst sentiment cooled somewhat over the summer, but the 19 tracked by MarketBeat continue to rate the stock as a Buy with only one dissenting Hold, no Sells, and a consensus target of $66. The $66 consensus target is down $2 from a year ago but still implies a nearly 60% upside for the market. The low target also offers some upside, highlighting the deep-value opportunity for investors. The short interest is healthy, below 3%, and insider selling is light, providing little headwind for the market. Institutional ownership is solid at over 80% and provides a tailwind for the market, with net activity bullish for the first three quarters of the year.
Jack in the Box Springs Into the #2 Position According to MarketRank
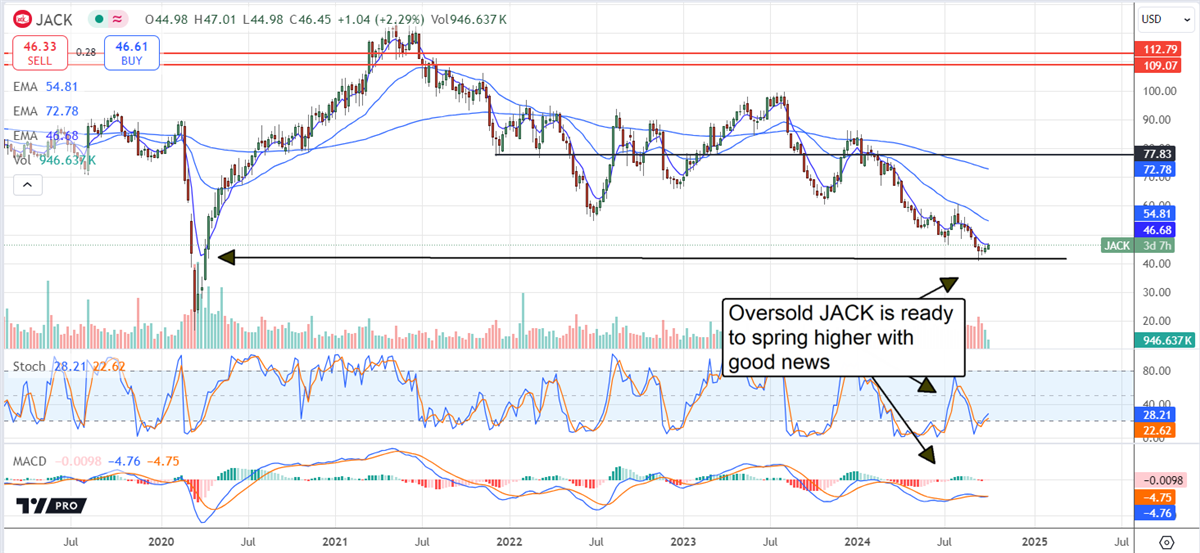
Jack in the Box (NASDAQ: JACK) is a smaller fast-food chain working diligently to re-franchise its network while expanding into new territories and growing organically within existing territories. Results in 2024 include a systemwide top-line contraction resulting from consumer habits, the re-franchise efforts, and a flat YoY store count offset by progress in the development pipeline.
The development pipeline includes nearly 100 agreements for 437 restaurants, of which roughly 10% have been completed. Among the latest details is a move into the Chicago-land region with a 12-unit franchising deal and at least another 100 opportunities for the local market.
Jack in the Box analysts trimmed targets and ratings in the first half 2024. However, the consensus is a strong Hold verging on Buy with a price target 50% above the $42 level, and the low-end range implies a deep value. The lowest target on record is $55 or about 18% upside, with only one analyst rating as Sell and nearly 50% at Buy. JACK stock pays a dividend worth 3.75% with shares at a four-year low, and the payment is safe. Distribution growth has been put on hold, but payments are less than 30% of earnings and are easily sustainable.
Investors Have a Friend in Ally Financial’s Dividend
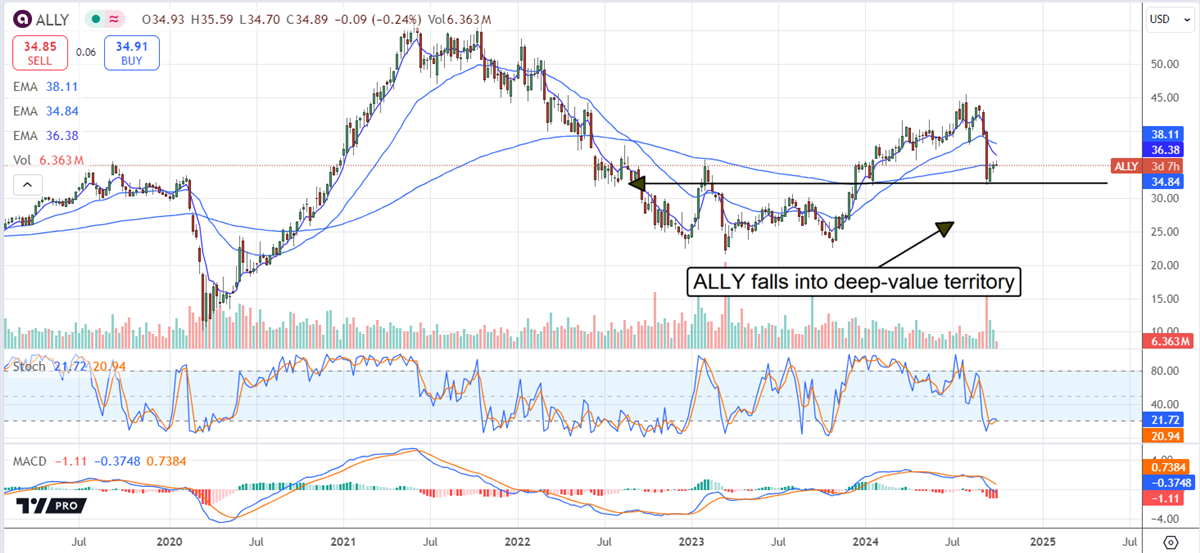
Auto-lender Ally Financial (NYSE: ALLY) faces struggles in 2024 due to economic conditions and weakened consumer strength, but it is in a solid financial position and can reliably pay its dividends. The latest results included a boosted outlook for credit write-offs, which impacted the share price and sparked a shift in analysts' sentiment favoring investors.
The analysts trimmed their targets over the summer but continue to rate the stock as a strong Hold verging on Buy, with the two sell ratings offset by eight buys and seven holds.
The latest update is from Citigroup, which added the name to its focus list. Analysts at Citi cited the new lows as an attractive entry point, believing the sell-off is unrelated to fundamentals.
Ally Financial’s dividend is worth about 3.35%, and the shares are near the 2024 lows. The company has not increased its distribution for several years, but growth is possible with the 45% payout ratio and improving earnings power. Adjusted EPS was flat YoY in Q2 despite the mid-single-digit contraction in revenue. Earnings are forecasted to nearly double from 2024’s levels in 2025.