Wells Fargo & Co. (NYSE: WFC) reported a relatively solid third quarter of 2024 earnings report, beating analyst EPS expectations by 14 cents. The finance sector laggard has done a remarkable job diversifying fee-based income to offset net interest income headwinds. Wells Fargo was a laggard heading into its report, and the resulting stock gains indicate the market was bracing for weaker performance. Despite its 2.4% YoY revenue decline missing consensus estimates, the market was very relieved with the performance, rewarding shareholders with a 10% rally in the following days.
The resulting rally enabled Wells Fargo stock to catch up to the performance of its peer money center banks like JPMorgan Chase & Co. (NYSE: JPM), Citigroup Inc. (NYSE: C), Capital One Financial Co. (NYSE: COF) and Bank of America Co. (NYSE: BAC).
Net Interest Income Continues Declining
Wells Fargo had another quarter of declining net interest income, which is a closely monitored performance metric for banks. It reported a seventh consecutive quarter of falling net interest income when it reported an 11% YoY drop to $11.7 billion in its fiscal Q3 2024 earnings. The company said it expects net interest income and net interest margin headwinds to continue to persist due to high funding costs.
This underscores customer migrations to the higher yielding deposit products like high-yield savings accounts, promotional products and certificate of deposits (CDs) along with deposit mix and pricing changes. The increased pricing on sweep deposits in advisory brokerage accounts and lower loan balances were partially offset by higher yields on earning assets.
Diversifying Non-Net Interest Income
To offset falling net interest income, Wells Fargo has been growing its fee-based income and keeping a tight lid on costs. Non-interest expenses were flat YoY as the company set aside less for potential credit losses. Its total net loan charge-offs dropped by 15% YoY, indicating that its credit quality appears to be solid. Its fee-based income rose 16% YoY during the first nine months of 2024, driven by strength in its Wealth and Investment Management services and fixed-income, currencies, and commodities (FICC) trading fees. The company expects net interest income to be in line with Q4 in Q4 2024. Full-year non-interest expense is expected to be around $54 billion.
Sluggish Loan Activity From High Interest Rates
One of the largest negative factors that stood out was its sluggish loan activity due to high interest rates. Consumer Banking and Lending is its largest segment, generating 45% of total revenue. Average loan balances fell 3% YoY to $32.9 billion. Again, the migration to higher-yielding products led to falling deposit balances that would be utilized for lending.
High interest rates clearly dampened the housing market and mortgage activity as home lending revenue rose 2% YoY. Auto lending fell sharply by 24% YoY as consumer spending softened, keeping them away from financing big-ticket items like cars. Wells Fargo adjusted its net interest income decline guidance for the full year 2024 to around 9% from its earlier forecast of 7% to 9%. On the bright side, the interest rate cut cycle will start to improve its lending activity as consumers resume borrowing at lower financing costs.
A Mixed But Relieving Report
Wells Fargo reported its third quarter of 2024 EPS of $1.42, which beat consensus estimates by 14 cents. Revenues fell 2.4% YoY to $20.37 billion, just shy of consensus estimates of $20.4 billion. Its Corporate & Investment Banking segment, generating 24% of total revenue, was flat YoY. Despite the improving IPO market, investment banking revenue fell $11 million YoY to $419 million. However, FICC trading fees helped Markets revenue climb 6% YoY to $1.75 billion. FICC gains offset the 24% YoY drop in equities revenue. Its Wealth and Investment Management segment had a solid performance, growing revenue by 5% YoY to $3.9 billion, driven by the strength of the broad financial markets.
WFC Stock Triggers an Ascending Triangle Breakout
An ascending triangle is comprised of a flat-top upper trendline resistance converging with an ascending lower trendline support. The breakout occurs when the stock surges through the upper trendline resistance, which becomes a new support level.
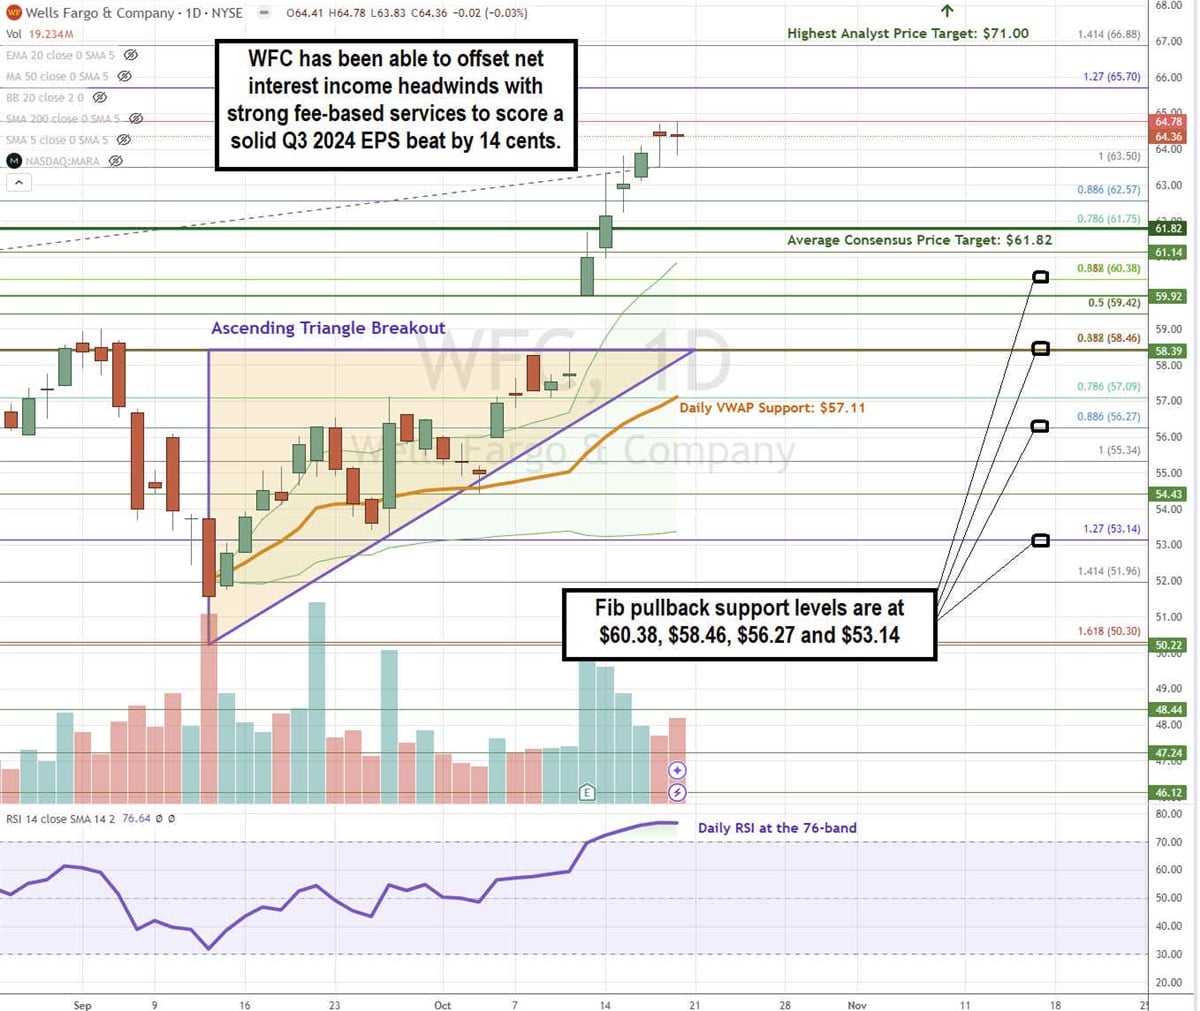
WFC formed the flat-top upper trendline resistance at $58.39 heading into its earnings report. The solid EPS beat triggered the ascending triangle breakout, gapping the stock to $59.92. Continued buying drove shares up to $64.78 as the daily RSI rose to the overbought 76-band. The daily anchored VWAP support is at $57.11. Fibonacci (Fib) pullback support levels are at $60.38, $58.46, $56.27, and $53.14.
Wells Fargo’s average consensus price target is $61.82, and its highest analyst price target sits at $71.00. It has nine analysts' Buy ratings and 12 Hold ratings. The stock trades at 12.57x forward earnings.
Actionable Options Strategies: Bullish investors can consider using cash-secured puts to buy WFC at the Fib pullback support levels for entry and write covered calls to execute a wheel strategy for income in addition to the 2.48% annual dividend yield.


