Conagra Inc. (NYSE: CAG) shares were punished by 10% after reporting its fiscal first quarter of 2025 earnings missing both top and bottom-line consensus estimates. While the company had warned earlier that fiscal year 2025 would be a transition year, investors were still surprised by the underperformance as the company hadn't missed consensus guidance since Q3 2020. However, a deeper dive into the food producer indicates there was a one-time production disruption that may have exaggerated the shortfall.
Conagra operates in the consumer staples sector, competing with food producers, including General Mills Inc. (NYSE: GIS), Campbell Soup Co. (NYSE: CPB) and Hormel Foods Inc. (NYSE: HRL).
Conagra’s Portfolio of Brands May Surprise You
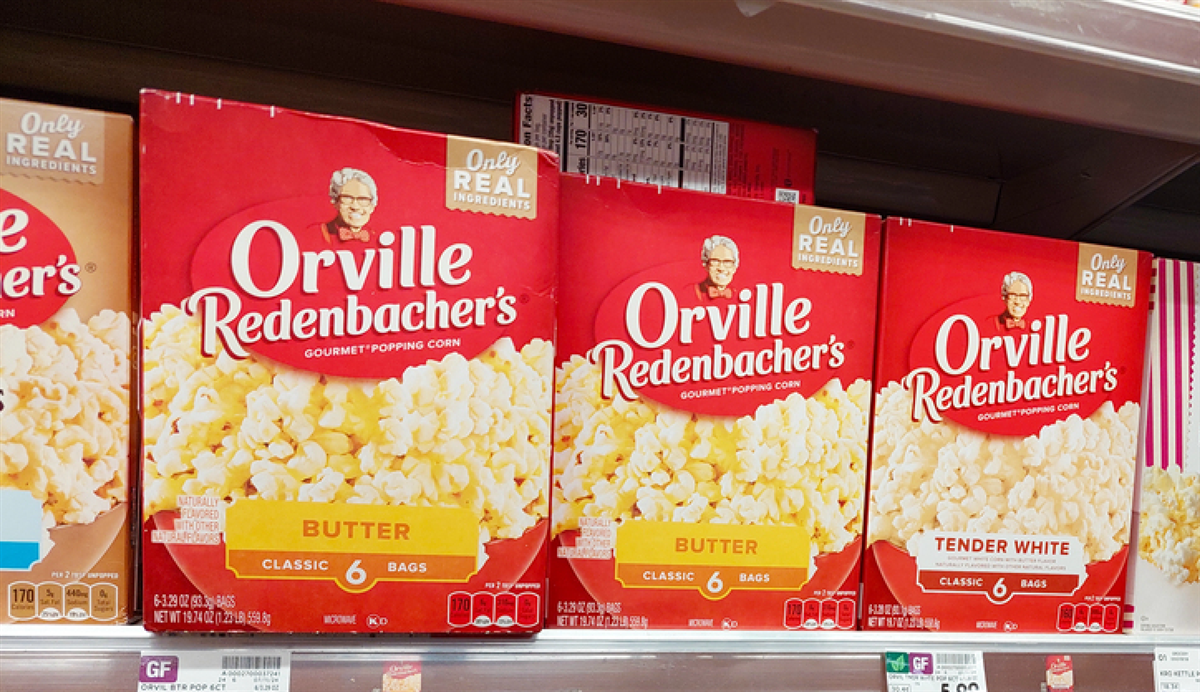
Conagra is a leading supplier of packaged foods to distributors, grocers, convenience stores and food service companies. Its portfolio of brands is chock full of familiar household names going back to your childhood. Their brands include Vlasic pickles, Hunt's tomato sauce, Swiss Miss hot chocolate, Duke's, Orville Redenbacher's popcorn products and Slim Jims Hebrew National hot dogs to frozen food brands including Banquet, Marie Callender's, Birds Eye' and Uni's Gluten-Free.
Conagra's Manufacturing Disruption
During the quarter, Conagra had to pause production at its Hebrew National hot dog plant due to a manufacturing disruption. Unfortunately, it was during prime grilling season, resulting in Hebrew National hot dog revenues plunging 47% YoY, trimming 90 bps off organic sales and 60 bps off consolidated volumes. The temporary manufacturing disruption impact was estimated at around $27 million. Fortunately, production has resumed but the damage was done.
Frozen Foods Took a Hit
Compounding matters, the Refrigerated and Frozen foods segment saw 210 bps shaved off sales and 150 bps trimmed off organic volume. That segment reported a 1.1% YoY sales drop to $1.1 billion. Foodservices revenue fell 7.8% YoY, stemming from the production shortfall. Tough macroeconomic conditions and food inflation contributed to softer consumer spending. The trend to trade down from brand name food products to lower priced private label products continues to impact Conagra. On a brighter note, Conagra gained a dollar share in frozen single-serve meals, frozen multi-serve meals and frozen breakfast categories.
Digesting All the Impacts
Looking at the full picture, Conagra reported fiscal Q1 2025 EPS of 53 cents, which missed consensus expectations by 7 cents as profits declined 20% YoY. Adjusted EPS fell 13.8% YoY to $528 million. Thinner profits and higher expenses cause gross margins to dip by 163 bps to 26%.
Revenues fell 3.8% YoY to $2.79 billion, which also missed consensus estimates of $2.84 billion. Organic net sales dropped 3.5% YoY, driven by a 1.9% negative impact from price/mix and a 1.6% decrease in volume. Grocery and Snacks sales fell 1.7% YoY to $1.2 billion. International sales fell 0.4% YoY to $259 million. Adjusted operating margin fell 244 bps YoY to 14.2%. Incidentally, Corporate expenses jumped 152% YoY to $92 million, reflecting higher incentive compensation. Net debt fell by 5.8% YoY to $8.6 billion, resulting in a 3.6x net leverage ratio for the quarter.
Conagra Reaffirmed Guidance
The company reaffirmed fiscal full year 2025 EPS of $2.60 to $2.65 versus $2.61 consensus estimates. Conagra reaffirmed full-year 2025 guidance for organic net sales to fall 1.5% to flat YoY. Adjusted operating margin is expected between 15.6% to 15.8%. The debt leverage ratio will fall to 3.2x.
Conagra Is Riding the Healthier Snacks Trend
Sean Connelly, CEO of Conagra, pointed out that its snack business is performing better than competitors due to the trend towards healthier snacks. Conagra is extremely focused on permissible snacks that are fiber and protein-rich. It's also non-Director-Store-Delivery (non-DSD), which keeps its snacks out of the chip space, enabling it to build scale in the permissible snack space for years. Permissible snacks are perceived to be healthier with lower calories, fat, sugar and sodium catering and also catering to dietary needs like being gluten-free like its Angie’s BOOMCHICKAPOP popcorn, David’s sunflower seeds, Act II microwave popcorn with light butter and 94% fat-free options.
CAG Stock Breaks Down Through a Rising Channel-Pennant Pattern
A rising channel pattern is comprised of two parallel ascending trendlines, including a rising upper trendline resistance and a rising lower trendline support. The breakdown occurs when the stock drops under the lower trendline support.
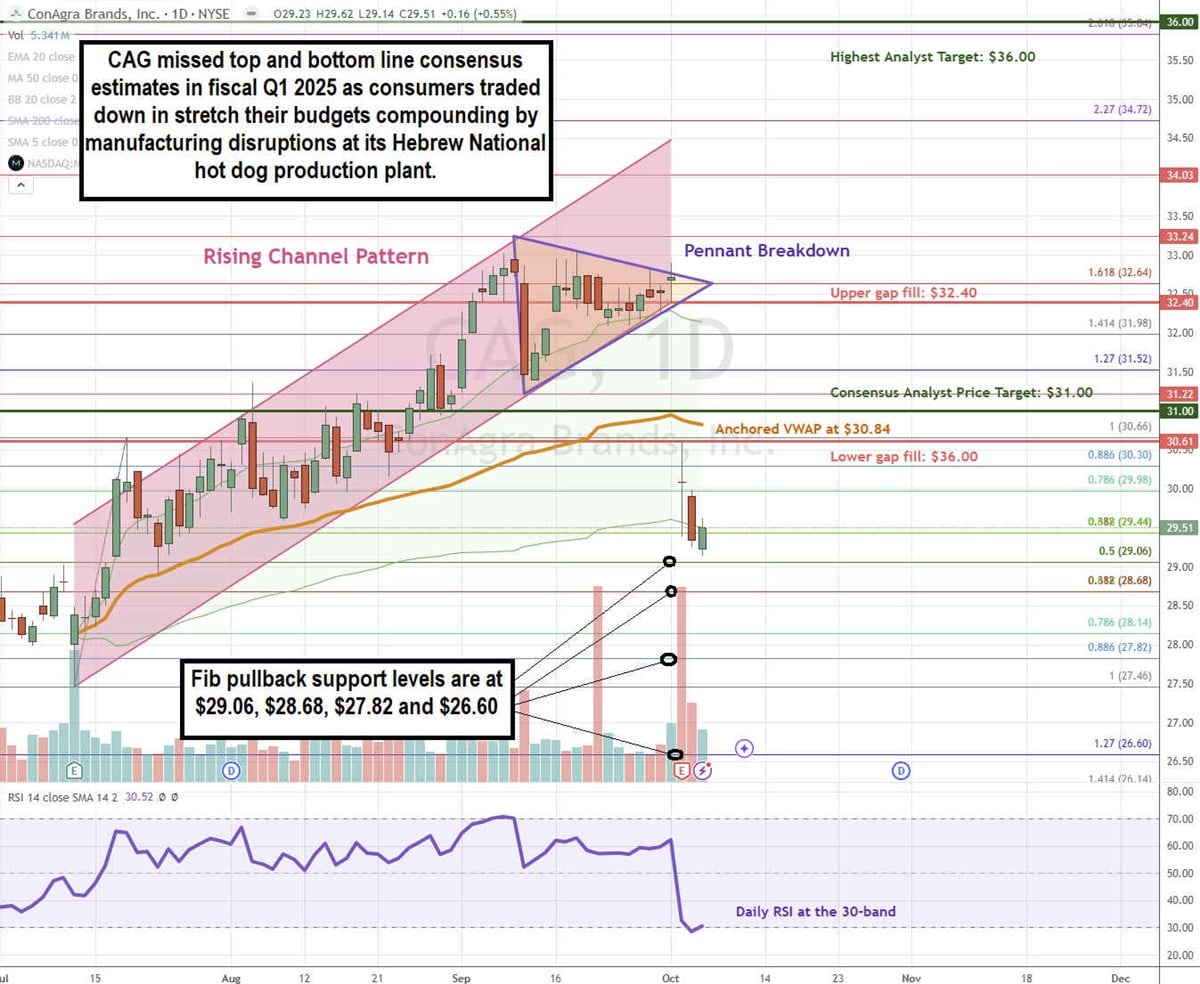
CAG commenced the rising channel off the $27.46 swing low on July 11, 2024, rising to a peak of $33.24 on Sept. 10, 2024. CAG formed a pennant following the peak comprised of the descending upper trendline and ascending lower trendline converging at the $32.64 apex point. The breakdown occurred on its earnings release, causing a gap down to $30.61, falling under its daily anchored VWAP at $30.84. The daily relative strength index (RSI) fell to the 30-band. Fibonacci (Fib) pullback support levels are at $18.93, $17.49, $16.71 and $15.85.
Conagra’s average consensus price target is $31.00, and its highest analyst price target sits at $36.00.
Actionable Options Strategies: Despite the earnings shortfall, Conagra is a solid consumer staples stock that has been a solid dividend income generator trading at just 11.31x forward earnings. Its push towards healthier snacks is riding a strong underlying consumer trend. Bullish investors can pick up CAG stock on pullbacks using cash-secured puts at the fib pullback support levels to buy the dip and write covered calls to execute a wheel strategy for income in addition to the hefty 4.74% annual dividend yield.


