Lam Research Co. (NASDAQ: LRCX) is a semiconductor equipment manufacturer that makes machines that help make computer chips. Specifically, their wafer fabrication equipment (WFE) focuses on front-end wafer processing, which prepares the raw silicon wafers to be transformed into computer chips. After the initial oxidation process, the wafers are then exposed to photolithography machines like those from ASML Holding NV (NASDAQ: ASML) that pattern the wafer as it moves along the process towards becoming a final computer chip product.
Lam Research stated that unrelenting demand for artificial intelligence (AI) has gone beyond what they initially expected. This was the main driver for posting a second consecutive quarter of double-digit revenue growth in its fiscal first quarter of 2025.
Fabrication Equipment: Lam Research Versus ASML
Lam Research’s machines are essential to the semiconductor production process just as much as ASML’s extreme ultraviolet (EUV) photolithography machines are. They both share the same major clients in the computer and technology sector, like Taiwan Semiconductor Manufacturing Co. Ltd. (NYSE: TSM), Samsung Electronics Co. Ltd. (OTCMKTS: SSNLF), and Intel Co. (NASDAQ: INTC).
Specifically, Lam Research’s machines perform disposition (create layers), etching (carve out the structures and designs) and chemical mechanical planarization (polish and smooth) on the silicon wafers. ASML's lithography machines create intricate circuit patterns on the chips. They are both intertwined in the production process. For this reason, it makes sense that their financial performance is closely linked.
Based on ASML's shocking Q3 2024 earnings shortfall, where they missed top and bottom lines as well as lowered their 2025 forecast, which triggered a 22% sell-off, analysts and investors were bracing for the worst with Lam Research’s fiscal Q1 2025 earnings report.
Proving the Analysts Wrong as It Outshines ASML’s Results
Contrary to ASML’s results, Lam Research beat top and bottom-line expectations.
The company reported EPS of 86 cents, which beat consensus estimates by 5 cents in its fiscal Q1.
Revenues surged 19.7% YoY to $4.17 billion, beating consensus estimates for $4.06 billion.
As for guidance, Lam Research provided in-line fiscal Q2 2025 forecasts for EPS of 77 cents to 97 cents versus 84 cents consensus estimates and revenue of $4 billion to $4.6 billion versus $4.24 billion consensus estimates.
Lam Has More Diversification Than ASML
Lam’s broader service offerings contributed to its outperformance, unlike ASML’s focus on EUV photolithography. The company cites a recovery in NAND spending, fueled by AI demand and technology upgrades, as key factors expected to drive growth beyond the WFE market in 2025.
Lam expects to benefit disproportionately in tech conversions as the materials transition from Tungsten to Molybdenum will create additional opportunities. Its NAND production wins will scale in 2025. Foundry/Logic and DRAM are expected to follow. Its SABRE 3D advanced packaging revenue is expected to more than double in 2024 as it gains market share heading into 2025.
The Trump Administration and Potential Growing China Scrutiny
With the Trump Administration taking over the White House in 2025, there has been a growing concern with companies that import manufactured products from China as well as sell technology to China. Lam Research received the majority of its total revenue, which was 37%, from China in fiscal Q1 2025.
On November 5, 2024, Lam Research and other semiconductor manufacturing equipment (SME) makers, including ASML, Applied Materials Inc. (NASDAQ: AMAT), and KLAC Co. (NASDAQ: KLAC), received letters from the House Select Committee on the Chinese Communist Party regarding their business with China.
The concern is that semiconductor equipment companies could be used by the People’s Liberation Army to gain an advantage in building advanced computer chips to reinforce China’s domestic chip capacity. This could then be used to supply chips to Russia’s war machine, threaten neighbors like Taiwan, progress China in critical fields like AI as well as make American sanctions less constraining. Investors have to be aware of the potential for more restrictions on sales to China once the Trump Administration takes over.
LRCX Forms a Descending Triangle Pattern
A descending triangle is a bearish chart pattern comprised of a descending (falling) upper trendline that represents lower highs converging with a flat-bottom lower trendline, indicating firm support. The breakdown occurs is the stock price collapses under the lower trendline. However, a reversal breakout can trigger if the stock surges above the upper trendline.
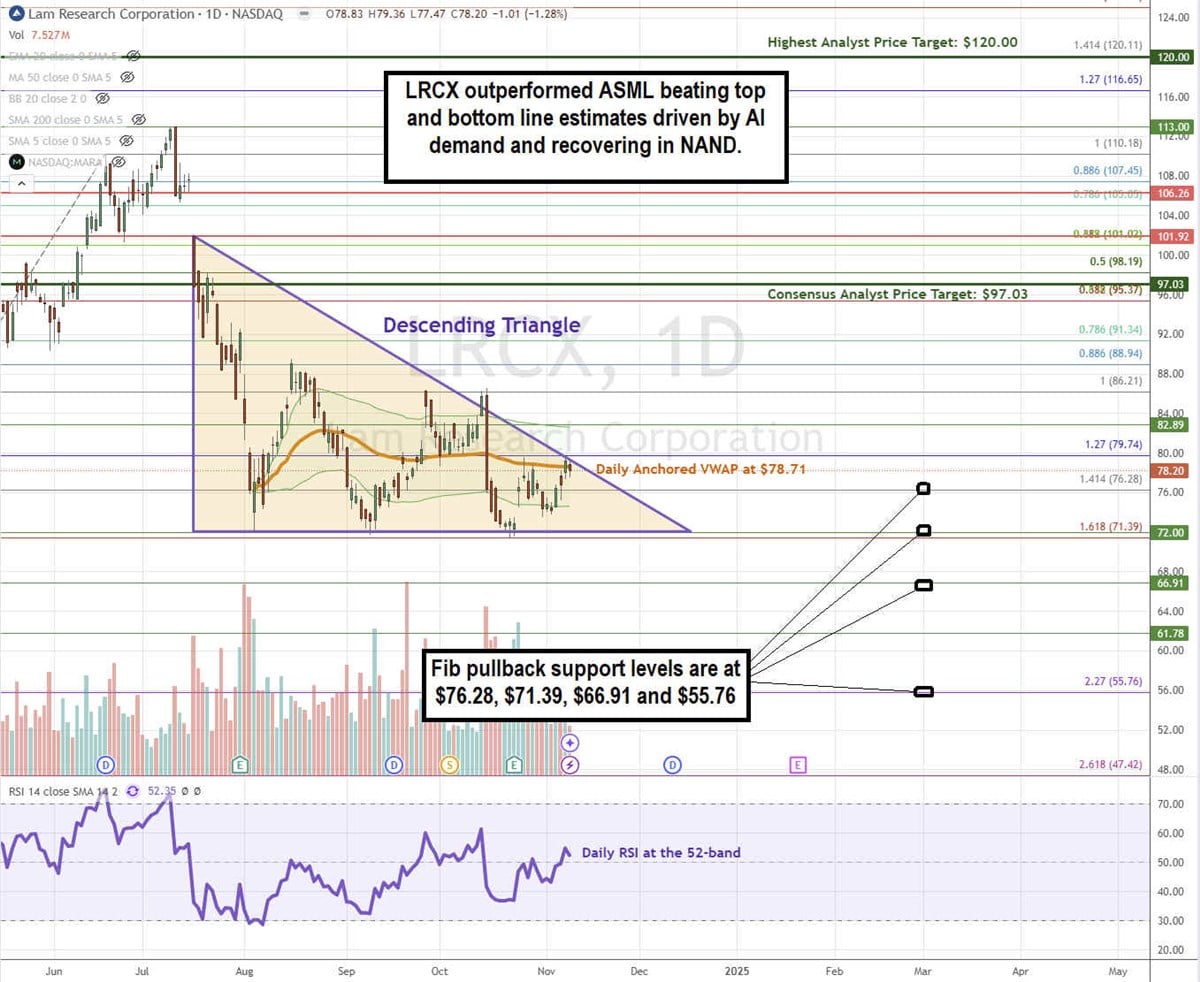
LRCX formed the daily descending triangle with the upper trendline resistance commencing at the $101.92 swing high converging with the flat-bottom lower trendline support at $72.00. LRCX is testing the $78.71 daily anchored VWAP and upper descending trendline as the daily RSI stalled at the 52-band.
As LRCX moves closer to the apex point, it will eventually break out through the upper trendline or break down through the lower trendline. Fibonacci (Fib) pullback support levels are at $76.26, $71.39, $66.91, and $55.76.
LRCX’s average consensus price target is $97.03 implying a 24% upside, and its highest analyst price target sits at $120.00. It has 14 analysts' Buy ratings and 6 Hold ratings. The stock has a 1.18% annual dividend yield.
Actionable Options Strategies: Bullish options investors can enter LRCX on a pullback using cash-secured puts at the Fib pullback support levels or take a bullish call debit spread for a breakout through the upper trendline resistance with less capital than owning the stock.


