Casey’s General Stores (NASDAQ: CASY) is on track for a stock split that may happen in 2025 because its share price, up more than 525% over the past decade, is only heading higher, putting it out of reach of “average” investors. What does that mean? High-quality businesses like Casey’s General Stores tend to like their share price to trade at a level where average investors, including their employees, can afford to buy shares regularly. When the price gets too high, it’s time for a split.
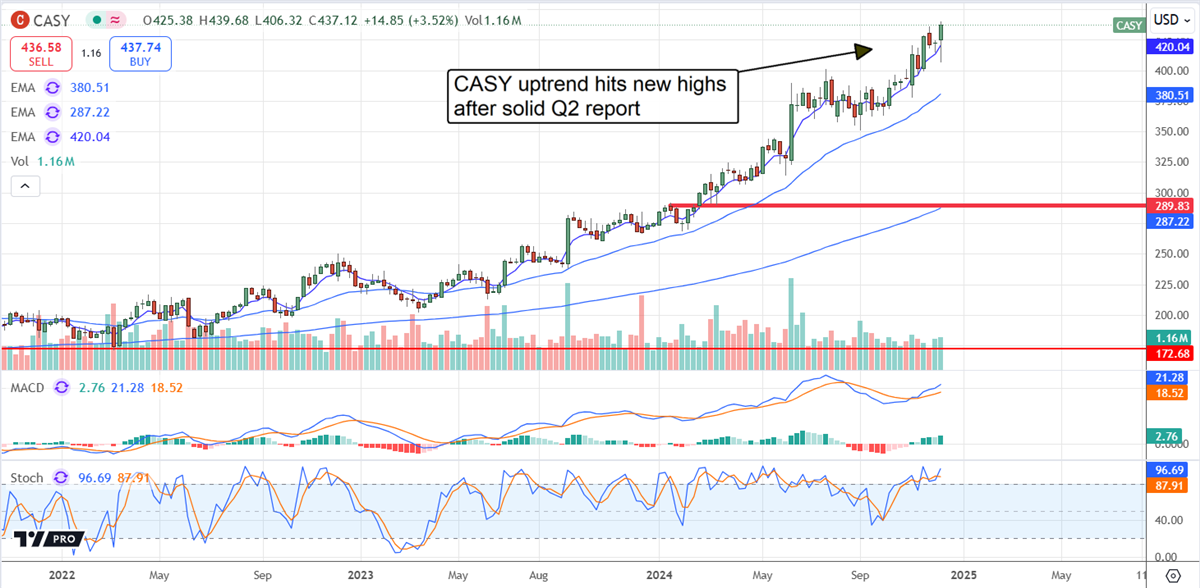
Assuming average investors can’t spend thousands monthly to buy only two or three shares, Casey’s General Stores' share price is entering the stock-split zone. It trades above $425 and is heading higher, driven by self-funded growth, strong margins, and capital returns.
Similar dividend-growth companies like Cintas (NASDAQ: CTAS) have set a precedent by splitting their shares on a 4:1 basis earlier in 2024. Although it has been many years, Casey’s has split in the past, so the precedents are strong, but it really doesn’t matter. Casey’s is a high-quality compounder, growing its business, capital distribution, and shareholder value; this stock will trend higher with or without a stock split.
Casey’s Q2 Results Reveal Sustained Strengths Driving Stock Price
Casey’s reported a mixed Q2 relative to consensus figures reported by MarketBeat but no less good because of it. The company’s revenue contracted due to lower fuel gallons sold and realized prices, but the miss is slim and offset by strengths in other areas. Critical details include a 4% inside comp, 7.1% in the two-year stack, and a wider margin.
Inside sales were driven by F&B, including hot sandwiches and cold beverages. The inside margin widened by 110 basis points and helped to drive leveraged growth on the bottom line despite the contraction in net revenue. Fuel sales, the larger segment and over 60% of the business, contracted by 0.6% and produced a narrower margin but still strong at over $0.40 per gallon and insufficient to offset the strength in inside sales.
The margin and cash flow are among Casey’s strengths. The retailer’s EBITDA margin runs near 10% and sustains a healthy cash flow, balance sheet, and capital return. The net result in Q2 is GAAP earnings of $4.85, up 14% compared to the top-line contraction, aided by internal efficiencies and share repurchases. The company didn’t repurchase any shares in Q2 because of the Fikes acquisition, but activity since the end of Q2 F2024 reduced the share count incrementally for the quarter. Repurchases will likely resume soon because there is still an active $295 million authorization, and the Fikes deal has closed. It is expected to be accretive by FQ4.
Casey’s Positive Cash Flow Sustains Growth and Capital Return
Casey’s balance sheet shows some changes, but they are all good. The company produced a solidly positive cash flow quarter by pausing the buybacks, setting itself up for strength now that the Fikes deal is closed. Highlights include increased cash, receivables, and long-term assets, only partially offset by increased liability. Equity is up by 10%, and leverage is very low despite the increase in debt, which is about 0.75x equity. This leaves the company in a flexible position to continue investing in its growth and possibly resume share repurchases as soon as the current quarter.
Analysts are responding favorably to the news. MarketBeat tracks a handful of revisions following the release that align with the trends. The trends include increasing coverage, firming sentiment, and a rising price target. The post-release revisions all increased their price targets, putting the market at an average of nearly $450 within the next 12 months. That is above the consensus and leading the market to new highs. A stock split isn’t guaranteed, but the price action is suggestive and may spur Casey’s board into action sometime next year.