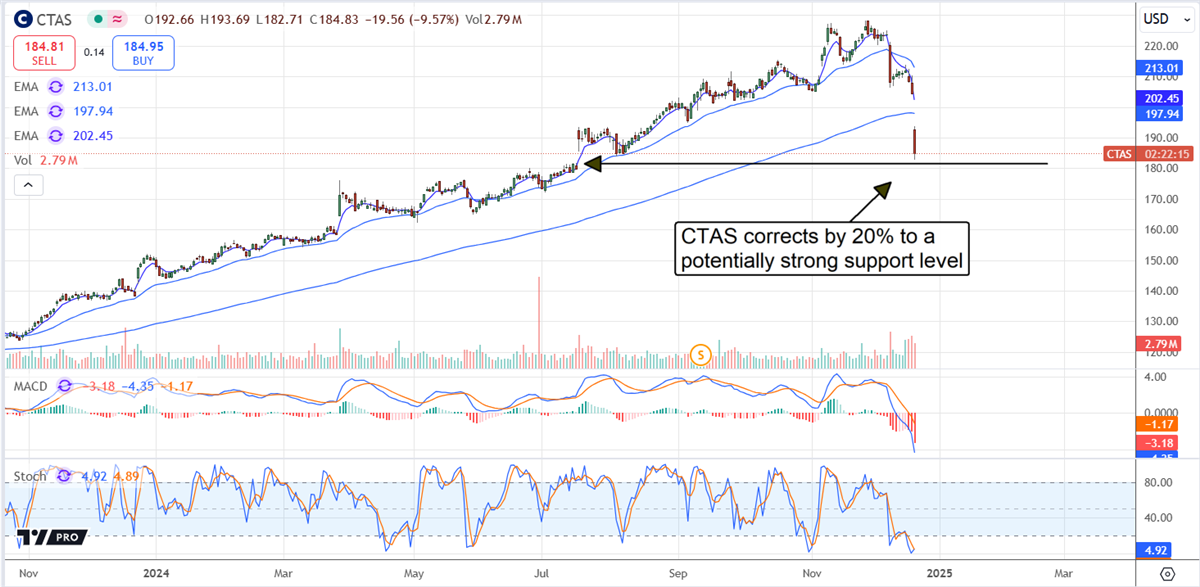
If you have watched Cintas' (NASDAQ: CTAS) share price rise over the last decade and perhaps were waiting for a post-stock-split plunge to buy in or buy more, your hopes have been fulfilled. The stock price began to correct in early December, which turned into a full-blown capital “C” Correction with the FQ2 2025 release. Down 20% after its release, the odds are high that Cintas stock price is near its bottom, and the time will come soon to buy it again.
Cintas Q2 results weren’t bad; they were good, with growth and a strong margin that supported balance sheet health and capital returns. The only problem is that results were mixed relative to the consensus, and trading at nearly 50x its earnings forecasts, the growth was likely priced in. This high-quality cash flow and capital return machine now trades at a still-high but more reasonable 43x the 2025 outlook, but more significantly, under 23x the long-term forecasts, which makes it a bargain. Analysts expect earnings to double over the next ten years, a reachable and potentially cautious estimate given the trends.
Cintas Falls on Mixed Results; Sustains Growth and Widens Margin
Cintas had a solid quarter and gave no reason for the market to sell off in its Q2 results. The $2.56 billion in revenue is as expected but up 7.8% compared to last year on strength in both segments. The core uniform segment is up 7.6%, led by an 8.5% increase in the smaller Other segment. Other include first-aid business Zee Medical, fire, and safety.
The margin news is better than the revenue, leading to outperformance on the bottom line. The gross margin expanded by 180 basis points and the operating margin by 210 on cost control and spending discipline. The net result is a 19.7% increase in net income and a forecast for margin strength to stick. More importantly, cash and free cash flow have improved significantly, with free cash flow up by 35% in the year’s first six months.
Guidance is another area of strength. The company improved the top and bottom line guidance, lifting the low-end range and mid-point for revenue while raising the outlook significantly. The new range for earnings puts the low end above the previous high end and may be cautious. Labor markets remain healthy. The data from November shows sustained employment growth, increased hours, and ample availability.
Cintas Capital Returns Are Safe, Reliable, and Growing
Cintas is among the healthiest dividend-paying stocks on the market, sustaining a fortress balance sheet while self-funding growth and returning capital to shareholders. Capital returns include dividends and repurchases, which reduce the count each year. Buybacks in FQ2 reduced the count by an average of 0.6%.
They are expected to continue reducing the count in the back half of the fiscal year and throughout 2025. The balance sheet highlights the impacts of this year’s acquisitions and capital returns, with cash down and liabilities rising. Still, the net impact is flat equity and an 8% increase in treasury shares, and leverage remains low with long-term liability less than 1x.
Analysts have yet to weigh in on Cintas’s results but have been supporting the price action in 2024. The consensus sentiment slipped to Hold from Moderate Buy as the stock price increased with the consensus price target. The revision trend lifted the consensus target for this industrial stock by nearly 50% in 2024, putting the market at $200 in 2025. The revision trend suggests a move to the high-end range is likely, good for a 30% gain from the $185 level. Institutions have also supported the stock price in 2024, buying on balance all four quarters of the year.