Defense stocks were on fire in 2024, with names like HEICO (NYSE: HEI) gaining more than 50% at the movement's peak. Now, pulling back, the question is whether this aerospace company is a buy or is it time to fly the coop, sit on the fence, and wait for better prices. Because the company is growing organically, acquiring businesses, generating cash flow, reducing debt, and supported by global trends, this stock will likely move higher next year. In that scenario, the question becomes the right price points to target.
HEICO Pulls Back on Mixed Results, Including Wider Margins and Record Profits
HEICO reported mixed results for Q4, but the expectations were high, results were solid, and the positive outlook makes the price pullback a likely buying signal for long-term investors. The company reported $1.01 billion in net revenue, up 7.9% compared to last year. The revenue missed MarketBeat’s reported consensus by a slim $0.02 billion, about 190 basis points, and is offset by a wider margin and a forecast for sustained growth in 2025.
The company’s Q4 and full-year revenue set a record driven by sustained strength in the Flight Support Group centered on the commercial business. Commercial business grew for the 17th consecutive quarter and is expected to grow in 2025 organically and via acquisition. Flight Support Group sales grew by 15%, 12% organic, offset by a slight decline in the Electronic Technologies Group. The Electronic Technologies Group is more sensitive to government spending, often resulting in what the company described as “lumpy” results.
Margin is another area of strength primarily driven by the Flight Support Group. The company logged a 140 basis point improvement in the consolidated operating margin, a 13% increase in EBITDA, a 15% gain in operating income, and a 35% increase in net income. Cash flow growth was also robust, growing by 39%, with the net result of $0.99 in GAAP earnings, up $0.25 compared to last year and a penny above forecasts despite the top-line weakness. The company didn’t give specific guidance for next year but is optimistic for growth in both segments and continued strength in FSG.
HEICO: Improving the Balance Sheet One Quarter at a Time
Critical details from HEICO’s Q4 results include balance sheet improvement. Highlights include a decreased cash position offset by increased current and total assets, reduced debt, and total liability. Equity is up 15% because of it, and leverage is declining. Debt to net income fell nearly two handles to 4.3x while long-term debt to equity fell to 0.6x from 0.77x, strengthening an already strong financial position. This is one reason for Warren Buffet’s interest and why Berkshire Hathaway (NYSE: BRK.A) bought into the stock this year. The holding is small but a vote of confidence and affirmation of outlook. Analysts see this defense company growing earnings by nearly 25% next year and 70% by 2028 versus the 2024 total.
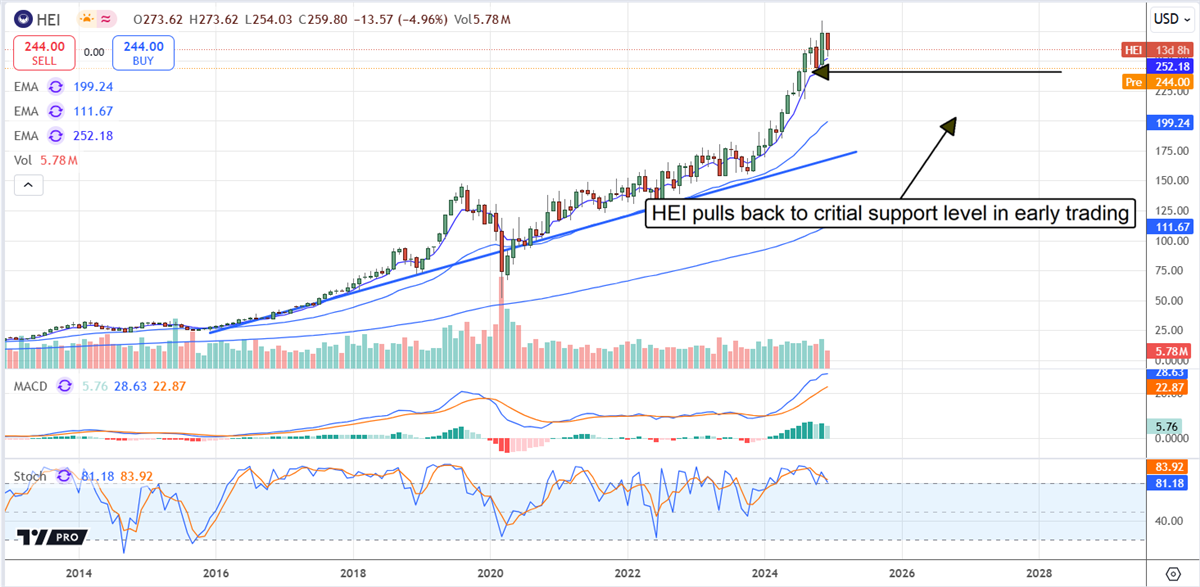
The analysts’ trends are positive in 2024 and unlikely to change now that Q4 results have been released. The analysts have issued revisions steadily throughout the year, lifting the consensus target by 35%. The consensus implies about 5% from the pre-release closing price and 10% from the critical support target, with the potential for another 7% to 10% in the high-end range.
The price action following the release is negative, with the shares down 5% in premarket trading. However, the market is above the critical support target and may trigger buying when the opening bell is rung. A move below the critical support near $245 is broken the market could fall to $225 or lower. If support is confirmed, investors can look forward to a rebound that will likely take this market back to retest the all-time highs and possibly set new highs.