When it comes to used cars in the United States, CarMax Inc. (NYSE: KMX) stands out as the largest used car dealership. The auto/tires/trucks sector giant operates more than 245 physical dealerships in the country, and it popularized the concept of a “no-haggle” pricing policy for buying used cars. The company buys, sells, services and also finances vehicle purchases through its CarMax Auto Finance division, which originates more than $8 billion in receivables annually.
The auto industry has been on a wild rollercoaster ride since 2019, as it saw an unprecedented surge during the pandemic and painful normalization afterward. However, CarMax is starting to reignite growth again following nine straight year-over-year (YoY) quarterly revenue declines. It also reported the widest earnings per share (EPS) beat since the first quarter of 2024.
CarMax has many competitors, from rival giant AutoNation Inc. (NYSE: AN) to Carvana Co. (NYSE: CVNA), local dealerships and online sites like Cars.com (NYSE: CARS ) and CarGurus Inc. (NASDAQ: CARG).
Q3 Marks Commences the Comeback Trail
Investors were treated to an upbeat Q3 2024 earnings report as CarMax earned 81 cents per share, firmly beating consensus estimates by 19 cents. Revenues grew 1.2% YoY to $6.22 billion, also firmly beating $6.15 billion consensus estimates. The positive revenue growth comes after nine straight quarters of YoY declines. This also beat analyst expectations for another YoY declining quarter.
CarMax Auto Finance (CAF) income rose 7.6% YoY to $159.9 million, driven by net interest margin percentage and average managed receivables. The company repurchased $114.8 million of stock in the quarter. Provision for loan losses stabilized in Q3 to $74 million, still up from a year ago at $68 million. This was an improvement over the previous Q2 provision at $113 million, up from $90 million in Q2 2023.
Stable Margins and Positive Revenue Growth Stood Out
Total retail used vehicle sales increased 5.4% YoY to 184,243 units. Comparable store used unit sales rose 4.3% YoY. Total retail used units sold rose 1.2% YoY, driven by the increase in retail used units sold and partially offset by the 3.9% drop in average retail selling price or approximately $1,100 per unit. Retail gross profit rose 1%, averaging $2,306 per unit. Wholesale gross margin rose 5%, averaging $1,015 per unit. Extended protection plans (EPP) margin rose $53 per unit to $573. The service margin grew by $60 per retail unit.
CarMax purchased 270,000 cars from consumers and dealers, up 7.9% YoY. From consumers, they bought 237,000 vehicles, up 4.1%. From dealers, they bought 33,000 vehicles, up 46.7% YoY. Total online sales rose 32% YoY on top of the 31% growth last year. This also includes all wholesale auction sales, which were virtual, representing 19% of total revenue in Q3.
CarMax CEO Bill Nash commented, “I am pleased with the positive momentum that we are driving across our diversified business model. Our solid execution and a more stable environment for vehicle valuations enabled us to deliver robust EPS growth driven by increases in unit sales and buys, solid margins, growth in CAF income, and ongoing management of SG&A.”
KMX Stock Is in an Ascending Triangle Pattern
An ascending triangle is comprised of a flat-top upper trendline resistance converging with an ascending (rising) lower trendline support. The breakout occurs when the stock surges through the upper trendline. If the stock collapses under the lower ascending trendline, then the pattern fails as a breakdown forms.
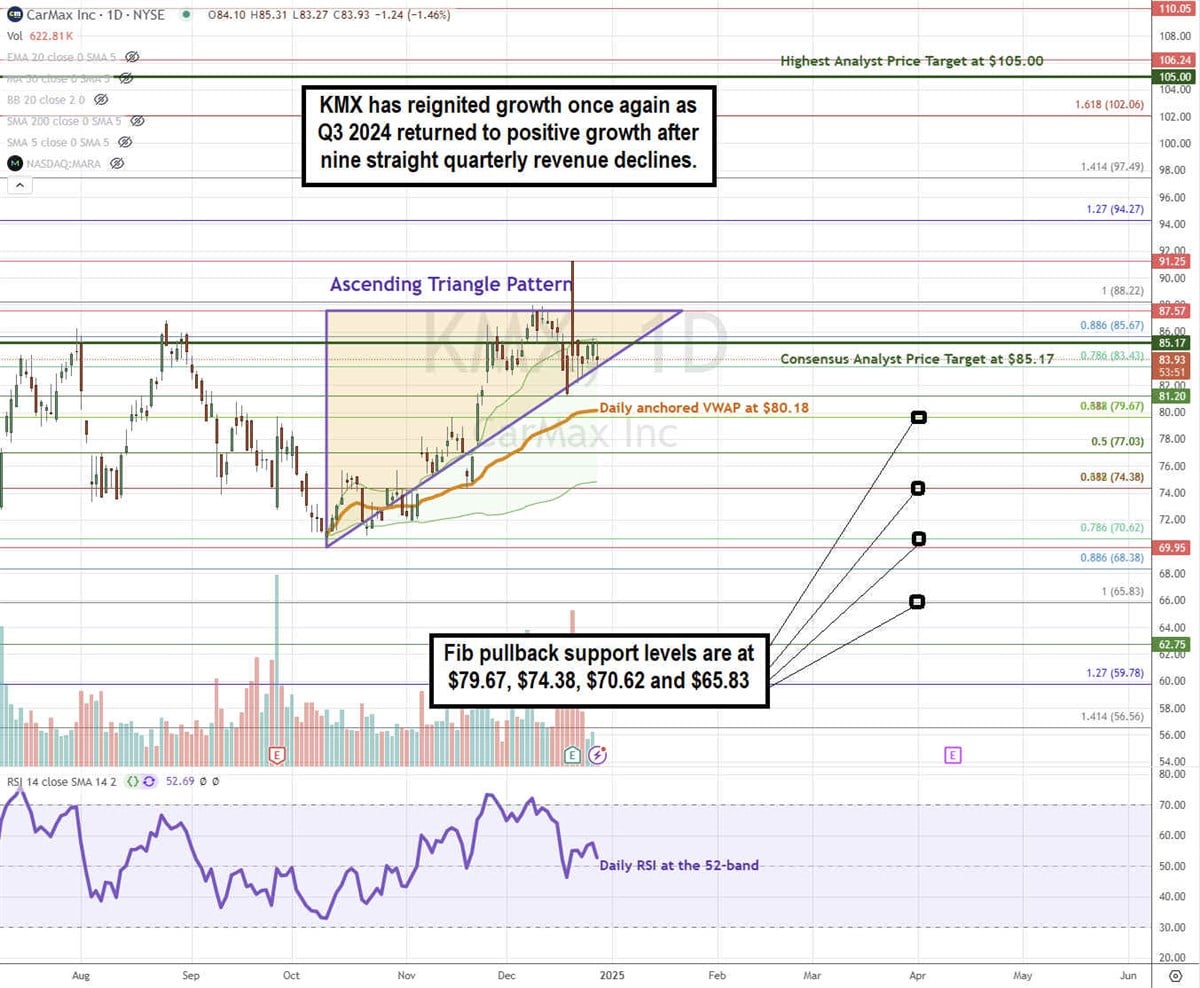
KMX formed the flat-top upper trendline resistance at $87.57, converging with an ascending lower trendline that formed at the $69.95 swing low. While the lower trendline has been tested and overshot three times, the daily anchored VWAP has been consistently holding support, which is now at $80.18. The flat-top upper trendline almost broke out after earnings until a gap and trap ensued, causing KMX to return to the ascending triangle range. The daily anchored VWAP is at $80.18. The daily RSI is chopping at the 52-band. Fibonacci (Fib) pullback support levels are at $79.67, $74.38, $70.62, and $65.83.
KMX's average consensus price target is $85.17, implying a 1.26% upside and its highest analyst price target sits at $105.00. It has six analysts' Buy ratings, five Hold, and three Sell Ratings. The stock has an 8.61% short interest.
Actionable Options Strategies: Bullish investors can consider implementing cash-secured puts at the Fib pullback support levels to buy the dip. If assigned the shares, then writing covered call at upside Fib levels executes a wheel strategy for income since there is no dividend.