Retail financial services giant The Charles Schwab Co. (NYSE: SCHW) reported its first-quarter 2024 earnings in the wake of the market sell-off. Despite initially gapping down on the results, shares managed to stage a rally back up towards 52-week highs at $73.88. The financial services sector leader continued to see positive deposit inflows as net interest margin expanded 13 bps QoQ up to 2.02% thanks to greater margin balance utilization and outstanding balance supplementation funding decline. The company competes with retail brokerages like Bank of America Co. (NYSE: BAC), owned by Merrill Lynch, and Morgan Stanley (NYSE: MS), owned by E-Trade and Robinhood Markets Inc. (NASDAQ: HOOD).
Banking Broker
Charles Schwab started as a discount broker that competed solely on providing fixed discounted commissions on stock trades versus the conventional percentage-based commissions that full-service brokers charged. Schwab helped reshape the stock trading commission landscape. As the years went by, Schwab expanded into wealth management, research, electronic trading and banking services.
Schwab was the pioneer in discount brokers and was influential in pivoting to zero-commission stock trades to fend off fintech disruptor Robinhood from taking more market share of the retail market. Banking services have grown to become a larger portion of its profits as one of the largest net interest margin income gainers. While interest income took a dip, the company still expects it to expand in 2024.
 Daily Ascending Triangle
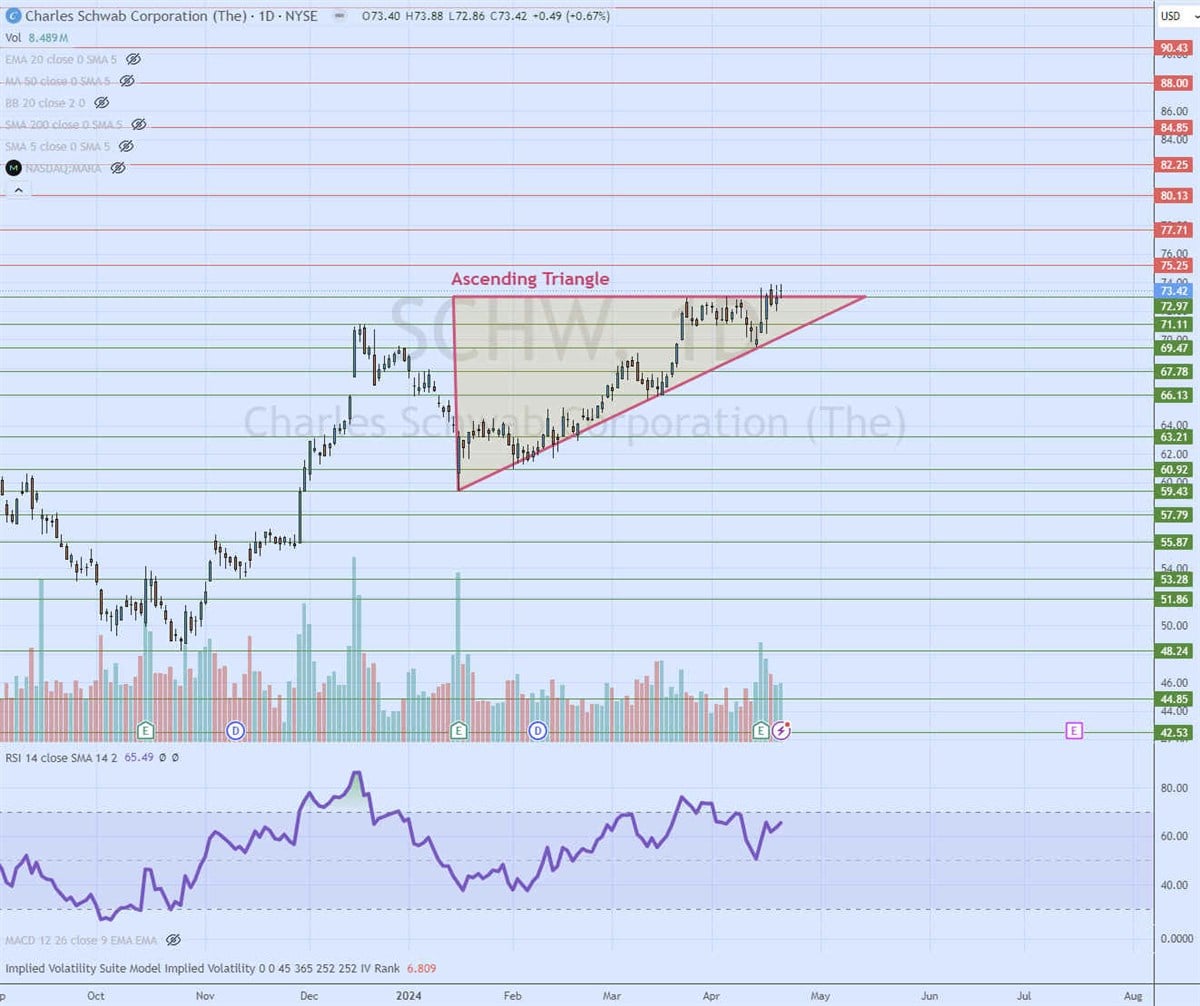
SCHW's daily candlestick chart illustrates an ascending triangle pattern. The ascending trendline formed at $59.43 on Jan. 17, 2024. Pullbacks formed higher lows as shares rose to the flat-top upper trendline at $72.97. As SCHW trades closer to the apex point, shares will either break out through the upper trendline or break down through the lower ascending trendline. The daily relative strength index is attempting to coil back up through the 65-band. Pullback support levels are at $69.47, $66.13, $60.92 and $55.87.
Top-line Miss but bottom-line beat
[content-module:CompanyOverview|NYSE: SCHW]
Schwab reported Q1 2024 EPS of 74 cents, beating analyst estimates by a penny. Revenues slipped 7.3% YoY to $4.74 billion but still beat consensus estimates of $4.71 billion. Net income totaled $1.4 billion or 68 cents per diluted share. The company took a $140 million restructuring charge. Total client assets reached a record $9.12 trillion. Active brokerage accounts rose 3% YoY to 35.3 million. Trading volume and margin balances grew 15% and 9%, respectively. Average revenue per trade fell 5% to $2.25, while total expenses fell 2%.
Inflows Were Still Impressive
Schwab saw $96 billion in core new assets. Its wealth solutions segment had $14 billion in net inflows, up 60% YoY, led by its premier fee-based Schwab Wealth Advisory. Pre-tax profit margins expanded by 500 bps. Organic earnings and a smaller balance sheet helped boost its capital position. The tier 1 Leverage ratio was 8.8%, and the Adjusted Tier 1 Leverage ratio was greater than 5%. While total net revenues declined YoY, strong client engagements drove sequential revenues up 6%.
Upbeat CEO Comments
Schwab CEO Walt Bettinger provided his outlook during its Spring Business Update call. The company continues integrating the Ameritrade acquisition and enhancing its digital platforms. Bettinger noted that inflation remained at moderate levels, although down substantially from the year-ago levels. The company experienced strong organic growth in the quarter. Net new assets rose just shy of $100 billion, with March alone generating $45 billion, up 6% YoY.
Buoyant Markets Led to Rising Customer Activity
Markets eased their expectation of interest rates cut but still remained buoyant as trading became more active, resulting in daily trading volume rising 15% QoQ and customer margin balances rising 9%. Total client interactions rose 17%. More actively led to more customers seeking help through its investment advisory solutions, driving revenues up 70% QoQ.
Ameritrade Integration Completes in May
The falling attrition rate of the Ameritrade acquisition was a key factor. The company plans to convert the last 10% of Ameritrade client accounts in May, which is mostly comprised of active traders and power users of the Think or Swim platform.
Bettinger concluded, “In my opinion, the combination of the best of Ameritrade with the best of Schwab sets the bar for anyone serving retail investors and independent investment advisers alike. Our combination of platform, service, dedicated relationships, investment advisory for retail clients and expertise serving independent investment advisers is a powerful combination for driving future growth.”
Ameritrade analyst ratings and price targets are at MarketBeat.