As stock markets reach new all-time highs, it's tough to find bargains among strong companies with frothy valuations. Steady and reliable may not be enough to excite the markets, but for value investors, these treats are hidden gems in plain sight. One such gem is Dole plc (NYSE: DOLE), a leading producer of fresh fruits and vegetables.
Dole competes in the consumer staples sector with Fresh Del Monte Produce Inc. (NYSE: FDP). Dole supplies fruits and vegetables to grocers, including Target Co. (NYSE: TGT), Costco Warehouse and Walmart Inc. (NYSE: WMT), which sells the most bananas of any retailer.
A Value Gem Hidden in Plain Sight
Dole's current market capitalization is just $1.22 billion, and it is trading at 0.15 price-to-sales (PS). Dole has a trailing PE of 6.79 and a forward PE of 11.16. Compare that to Fresh Del Monte with a trailing PE of 15.19, forward PE of 17.92, and a PS of 0.27. Del Monte does half the revenues of Dole and yet trades at a higher valuation. However, Del Monte takes the win in terms of dividend yield at 4.11% versus 2.48% and debt-to-equity at 0.21 versus 0.61.
Comparing Sweet to Sour Fruit Results
The real difference between the undervalued Dole and arguably overvalued competitor Del Monte is their latest Q1 2024 results. In Q1 2024, Del Monte saw net income fall 33% YoY to $26.1 million while revenues sank 1.8% YoY to $1.11b. Conversely, Dole saw net income rise 220% to $65.4 million, and revenues climb 6.6% to $2.1 billion. Of course, Dole also completed the sale of a 65% equity stake in Progressive Produce for a $74 million gain on $120.3 million in proceeds. Dole took proceeds to reduce its debt by $100 million to $776 million at the end of the quarter. Adjusted EBITDA row 9.7% to $110.1 million.
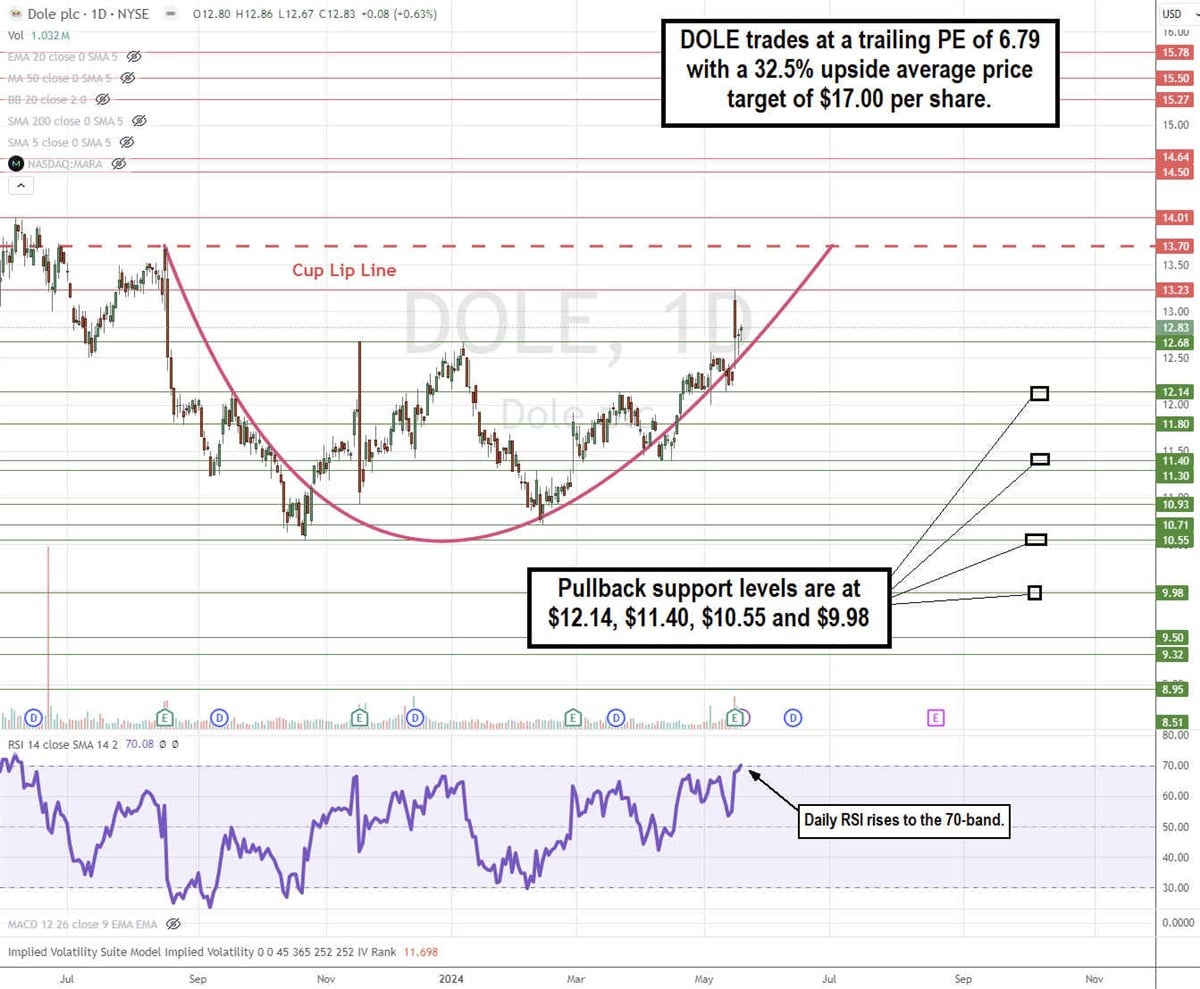
Daily Cup Pattern
DOLE formed a daily cup pattern. The daily cup lip line formed at $13.70 on August 17, 2023. Shares fell to a low of $10.55 by October 24, 2023. DOLE formed a higher low at $10.71 on February 14, 2024, before grinding its way back up toward the cup lip line. The daily relative strength index (RSI) rose to the 70-band. Pullback support levels are at $12.14, $11.40, $10.55 and $9.98.
Robust Business
Dole reported Q1 2024 EPS of 43 cents, beating consensus estimates by 12 cents. Adjusted net income was $40.6 million. Adjusted EBITDA rose 9.7% YoY to $110.1 million. Revenues rose 6.6% YoY to $2.12 billion, matching consensus analyst estimates. Growth emerged across all segments. Strong operational performance and a favorable FX impact of $12.8 million were partially offset by a net negative impact from acquisitions and divestitures of $13.3 million. Net income was $45 million due to strong operational performance across the Group in addition to the gain of $74 million from the sale of Progressive Produce offset by a goodwill impairment of $36.7 million.
Segment Performance
The Fresh Fruit segment's revenues increased 3.2%, or $25.3 million, due to a higher worldwide volume of pineapples and bananas sold. Pineapples saw an increase in worldwide pricing, while banana prices fell. Adjusted EBITDA rose 0.3% to $0.2 million, driven by higher volumes, lower pricing, and fruit sourcing costs.
The Diversified Fresh Produce EMEA segment saw a 7% rise in revenues, or $55 million, due to strong performance in Northern Europe, the U.K. and Ireland. Revenues rose on a like-for-like basis by 4.7% YoY, or $36.7 million, ahead of the prior year.
The Diversified Fresh Produce for the Americas and rest of the world (ROW) revenues rose 12.8% YoY or $54.1 million. Dole attributed the revenue increase to higher volumes of cherries sold, improved pricing and volume of avocados, and strong pricing across most commodities. Adjusted EBITDA grew 89.3% or $6.9 million.
Outlook for Fiscal 2024
Forecasting the full year remains complex, but Dole is maintaining its target to achieve full-year adjusted EBITDA in line with 2023 on a like-for-like basis or $360 million after adjusting for the disposal of Progressive Produce. Capex for fiscal 2024 is expected to range from $110 million to $120 million. The company plans to reduce interest expense guidance in the range of $75 million to $80 million.
Dole CEO Rory Byrne commented, "While it's still early in the year and forecasting remains complex, we are maintaining our target to deliver full-year adjusted EBITDA in line with 2023 on a like-for-like basis. In dollar terms, adjusting for the progressive project disposal implies an adjusted EBITDA target of at least $360 million for the full year.