The technical action in Casey’s General Stores (NASDAQ: CASY) is robust and has the market up 200% from the lows set in 2022. The rally is driven by growth, improving fundamentals, and a reinvigorated market position that is only improving. The company began a three-year plan to boost sales, widen margins, and gain retail market share in 2022, which is already delivering results.
The takeaway from the Q4 F2024 report is that growth exceeded expectations, margins widened significantly, and strength is expected to continue in F2025. The news has analysts raising their targets and leading the market higher, resulting in a trend-following signal for investors.
Casey’s General Stores has Beat-and-Raise Quarter
Casey’s General Stores Q4 results reveal a corporate engine firing on all cylinders. The $3.6 billion in revenue is up 8.1% and 370 basis points ahead of the consensus estimate on strength in all segments. Inside comp-store sales are up 5.6% on strength in prepared foods offset by a smaller 4.3% increase in grocery; Casey’s value proposition aids both segments. Fuel sales are also solid, with comparable gallon sales up by 0.9% and total sales up by 9.3% on an increased store count.
The margin news is more impressive. The company widened its margin in both operating segments to leverage the top-line strength into accelerated earnings growth. Inside comp gross profit increased by 16.2%, trailed by a 15.4% increase in fuel margin. The strength led to a 57% increase in GAAP earnings, leaving the $2.34 $0.64 or 3700 basis points above estimates. The best news is the guidance, which expects the margin to hold steady over the coming year while the company expands and grows comp sales by 3% to 5%.
Cash flow is among the market-moving details for Casey's. The company generates significant cash flow, allowing for self-funded expansion. The balance sheet highlights include increased assets, debt reduction, and increased equity. Leverage remains low, with total liabilities about 1.1x of equity and ample liquidity.
Casey’s Capital Returns are Growing
Casey’s balance sheet and cash flow allow for self-funded growth and capital returns. The only caveat is that the distribution is small at 0.53% yield and 15% of the earnings, but it is safe, reliable, and growing. The latest increase is worth nearly 15% to investors and is a testament to the company’s health. Because the growth outlook is positive, the cash flow is solid, and the balance sheet is healthy, next year’s increase will likely be another large one.
Capital returns include share repurchases. The share repurchases in Q4 amounted to $15 million, aiding a 0.8% reduction in the average share count. Total buybacks in 2024 were $105 million, leaving $295 million or enough for nearly three years at the current pace. The growth outlook, balance sheet, and cash flow suggest buybacks may accelerate.
Casey’s General Stores Advances to New High, Bears Retreat
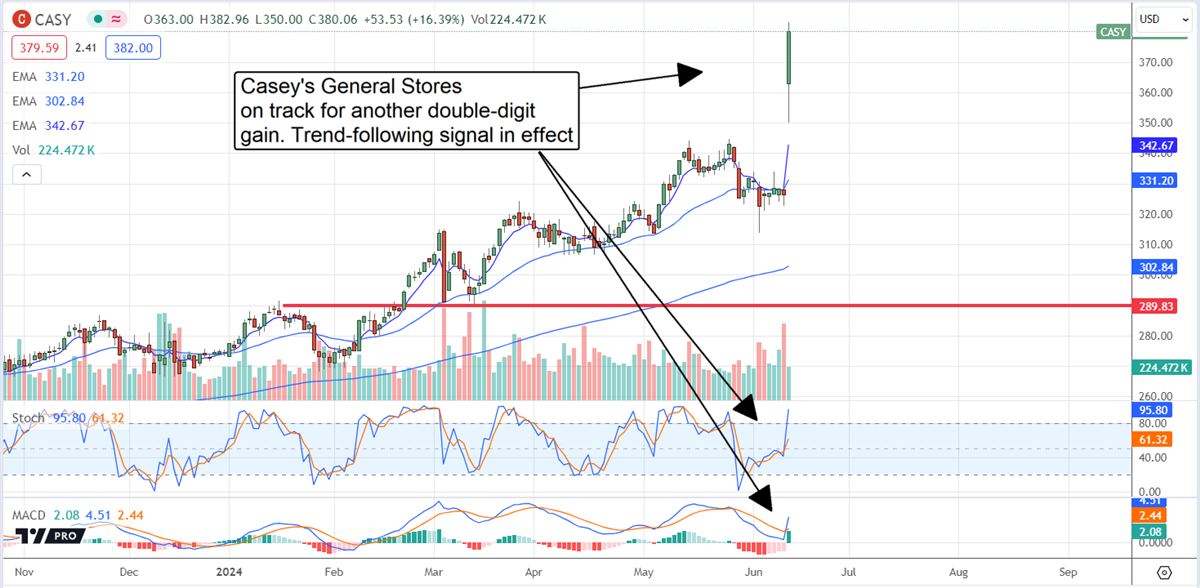
Casey’s General Stores’ trend-following signal includes a 10% gap higher at the open and another 500 basis point advance that confirms support at the short and long-term moving averages and the recent high. The signal is compounded by a strong signal in MACD and stochastic that suggests the move has legs.
In this scenario, Casey’s General Stores stock could advance another 10% to 15% soon. The hurdle is the analysts. The analysts have begun raising their targets but lag the market. The first to show on MarketBeat’s radar is an upward revision from RBC that puts the stock near the high end of the analyst range, slightly below the post-release price action.