The Federal Open Market Committee (FOMC) didn’t exactly give the market what it wanted, but the policy statement and outlook have the S&P 500 (NYSEARCA: SPY) on track to hit new highs. High inflation and high interest rates aside, the US economy is growing, labor markets are healthy, and inflation is tracking lower, which has the Fed on track to cut rates. In the eyes of the market, the statement signals a pivot in policy that should spur economic activity and S&P 500 earnings growth. High inflation and interest rates are a worry in this environment, but the index can continue to climb higher.
The New Normal Isn’t New Anymore, It’s Just Normal
Investors must remember where it came from to keep the current Fed policy in perspective. FOMC policy had been ultra-lenient for over a decade until early 2025, when the committee began its tightening cycle. At the time, the call was to “normalize” interest rates and the economy, which is where we are today. Historically, FOMC policy averages between 4% and 10%, which puts the current policy in the low-end range. In this situation, the FOMC could continue to hike rates again if necessary to curb inflation.
Inflation is cooling; that’s a fact. The latest CPI report aligns with an outlook that inflation will cool to the FOMC target of 2% by 2026. The problem for the FOMC is that inflation is cooling ever so slowly, leaving them little choice but to keep rates where they are. As it has been all along, the risk for them is that cutting rates too soon will unleash the economy and spur inflation to new heights. The housing market alone has enough pent-up demand to sustain economic growth and consumer prices.
Among the Fed's problems is interest rates. They can’t keep them high forever because rising rates impact everyone's borrowing costs, including the US government. The Committee for a Responsible Federal Budget estimates that a 50 basis point hike would increase the budget deficit by $1 trillion and put the US on the brink of default.
The CBO estimates that credit costs will run nearly $850 billion this year alone and double in the next decade due to the deficit and high rates, increasing the risk of default. In this environment, the Fed is left walking a tightrope between fiscal policy and fiscal responsibility. Rates must stay high enough to combat inflation but low enough that US debt doesn’t spin wildly out of control.
The FOMC Said Higher for Longer and Meant What It Said
The Fed indicated it would cut rates this year but trimmed the forecast from three cuts to one. The best-case scenario is that this cut will come by November, but there is risk. The pace of inflation hasn’t slowed enough to warrant a rapid pace of rate cutting, which means the Fed may only cut once and then sit back to see what happens. Because the pace of inflation isn’t slowing quickly and the Fed is notorious for walking back on its outlook, it is also possible there will be no cut this year. As it is, the CME FedWatch Tool shows the market pricing in the first cut for November.
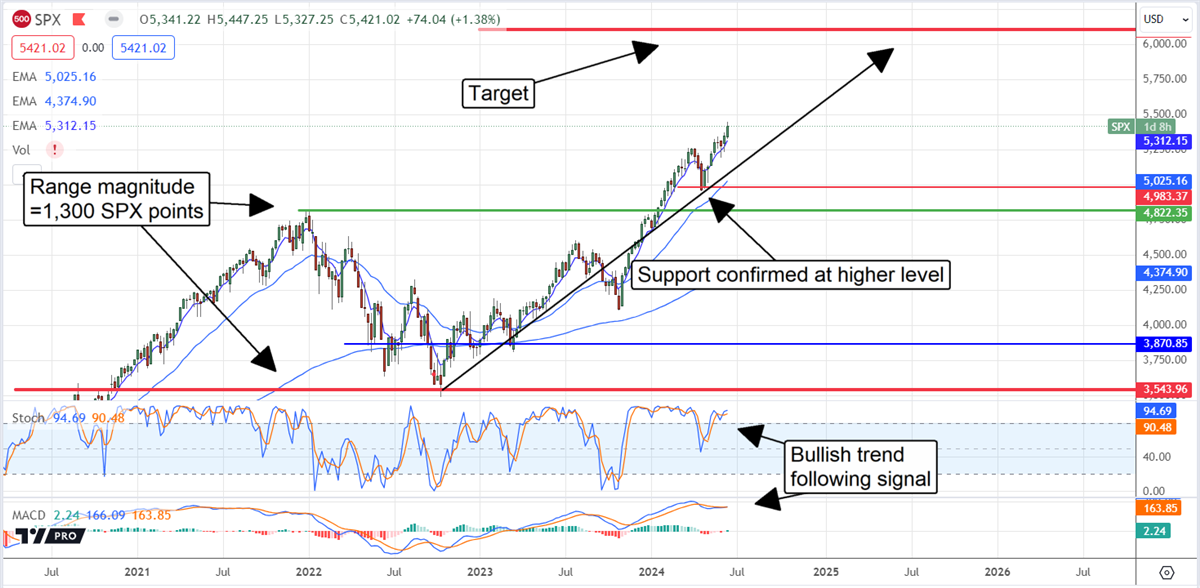
The outlook for earnings is what is driving the market. The consensus estimates that S&P 500 earnings growth will accelerate sequentially through the end of the year and that annual growth will accelerate from this year to the next. This outlook shows that the S&P 500 is in rally mode, and it looks like it will continue to rise. The technical action following the Fed announcement was tepid but led to a significant gap higher the next and is confirmed by buy signals in MACD and stochastic.
There is substantial potential in the S&P 500. The market is moving higher after breaking out of a secular grade trading range with a magnitude of nearly 1,300 points. Because the move to new highs is driven by earnings growth, earnings growth acceleration, and a forecast for the trend to continue, it could easily move above the breakout point by the exact figure. This puts a target of SPX 6,100, which may be reached by the end of the year.