
The insurance industry is being rattled by fintech disruptors like Lemonade Inc. (NYSE: LMND). Critics will say that underwriting policies are an art form and that human actuaries and adjusters can’t be replaced by artificial intelligence (AI). Insurance policies are best drawn up face-to-face with an actual agent. Lemonade is trying to prove otherwise. Compared to industry giants, Lemonade’s revenues are a drop in the bucket. However, their operating model, which relies heavily on leveraging AI, may become the new paradigm. Investors should take note as Lemonade moves closer to cash flow breakeven, which was just bumped up by a quarter.
Lemonade operates in the finance sector and competes with insurers like The Allstate Co. (NYSE: ALL), Berkshire Hathaway Inc. (NYSE: BRK.B), and Root Inc. (NASDAQ: ROOT), which operates a direct-to-consumer (DTC) model.
Lemonade is Growing Its Portfolio of Coverage
Potential customers can conveniently onboard with a Lemonade insurance plan in a matter of minutes through its mobile app. The variety of insurance products, including homeowners, renters, car, term life, and pet insurance, continues to expand. Customers can enjoy additional savings by bundling these insurance products. Lemonade thrives on convenience and lower rates to lure customers to try their policies and continue to add on and bundle them.
Here’s How Lemonade Leverages AI
Users of Lemonade come in contact with AI immediately when applying for coverage or placing a claim. Its AI chatbot, Maya, walks users through the steps towards completion and onboarding. Numerous factors determine premiums, and 50 machine learning (ML) models are used to analyze the customer. It uses predictive analytics to determine if they will buy, churn, cross-sell, or file claims. AI algorithms analyze customer data and property information to assess risks and provide personalized quotes.
When claims are filed, AI analyzes photos and damage reports to automate claims assessment and expedite payouts for simple cases while kicking up more complex cases to its human adjusters. AI is used to streamline operations and offer a more efficient experience. The company also focuses on social good, which appeals to millennials and Gen-Z-ers.
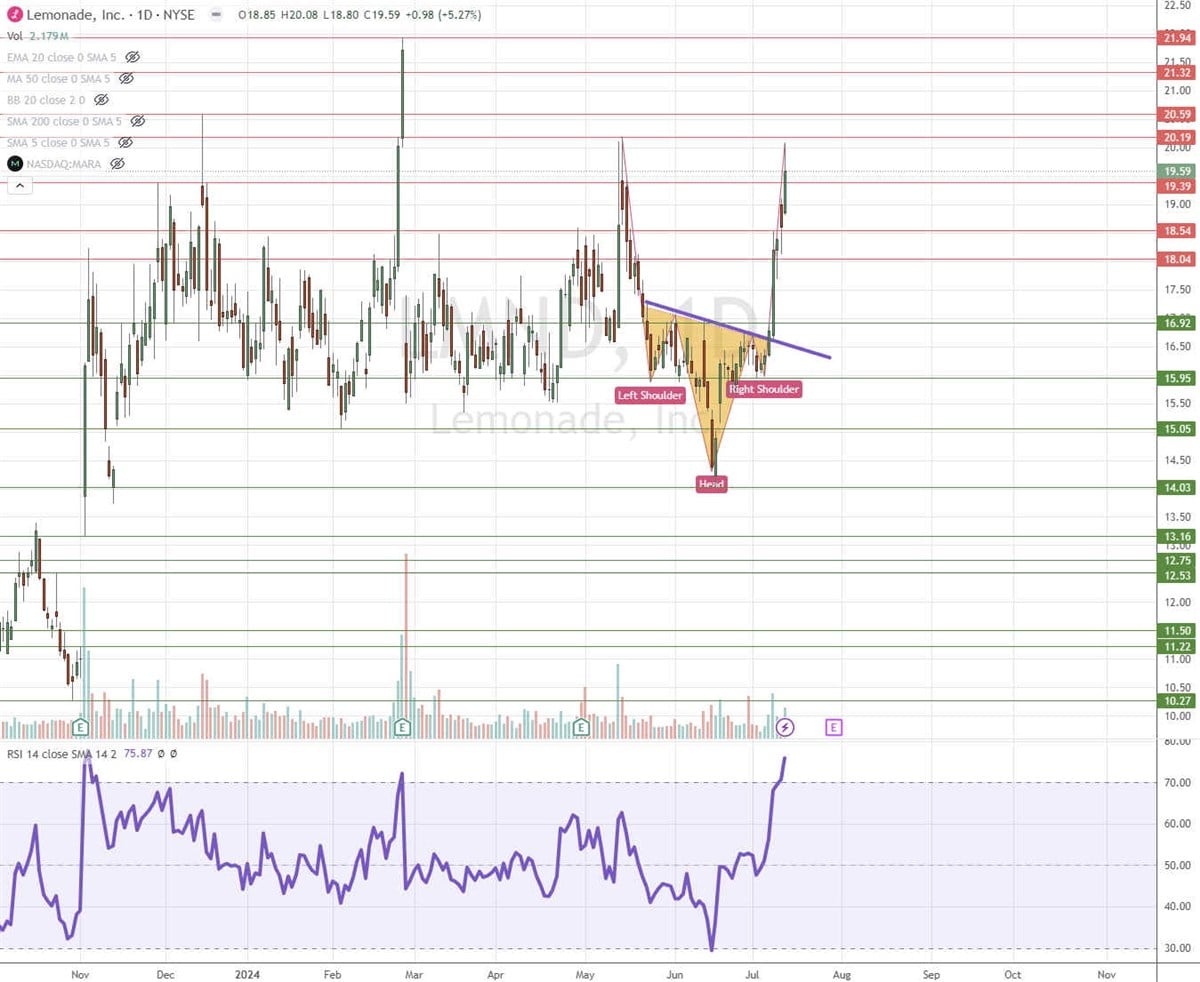
LMND Stock Triggers an Inverse Head and Shoulders Breakout
The daily candlestick chart on LMND illustrates an inverse head and shoulders breakout pattern. This is comprised of three valleys that share a neckline, which serves as the breakout trigger. The left shoulder formed at $15.95 on May 23, 2024, and touched the neckline on a pullback before bottoming to form the head at $14.03 on June 17, 2024. The pullback occurred, retesting the neckline before forming the right shoulder at $15.95. The neckline breakout was triggered on July 8, 2024, through the $16.60 neckline as shares roared toward the $20.19 swing high. The daily relative strength index (RSI) surged through the 80-band. Pullback support levels are at $16.92, $15.95, $15.05, and $14.03.
Lemonade's Q1 2024 Results: Setting the Stage for Future Growth
Lemonade reported a Q1 2024 EPS loss of 67 cents, beating consensus estimates by 14 cents. Revenues rose 25.1% YoY to $119.1 million, exceeding expectations of $114.13 million. In-force premiums (IFP) grew 22% YoY as total revenues rose 25% YoY. IFPs are the total value of premiums associated with active policies helped by customers. The gross loss ratio was 79% versus 87% a year ago. This metric measures profitability by comparing the total amount paid out in claims to the total amount of premiums collected. The lower the gross loss ratio, the more profitable the insurer may be since they are paying less in claims than the premiums coming in. Gross loss ratio focuses on underwriting profitability.
Lemonade's Mixed Guidance for Q2 and 2024
For Q2 2024, Lemonade issued lower guidance of $118 million to $120 million versus $123.05 consensus estimates. IFP is expected to be between $839 million and $841 million. Adjusted EBITDA is expected around a loss of $49 million to $47 million versus a loss of $33.9 million in its prior quarter.
Lemonade provided in-line guidance for full-year 2024 with revenues between $511 million and $515 million. IFP is expected to be between $940 million and $944 million. Full-year Adjusted EBITDA is expected to be a loss of $155 million to $151 million, better than previous expectations for a loss of $160 million to $155 million. IFP is expected to be between $940 million and $944 million, up from earlier estimates of $938 million to $938 million and $942 million.
Achieving Cash Flow Breakeven: Lemonade's Strategic Progress
Lemonade has revised its expectations for reaching cash flow breakeven, now anticipating this milestone by the end of 2024, ahead of its previous guidance for the first half of 2025. Lemonade CEO Dan Schrieber commented, “In fact, we're happy to update that we now project the net cash flow positive by the end of this year. This acceleration in our cash flow profitability is made possible by a couple of factors, the most notable being how technology, in general, and AI, in particular, continue to deliver on the promise at the very core of Lemonade's thesis. This quarter, for example, saw a 22% top-line growth but only a 2% increase in operating expense and an 11% decrease in headcount, all of these metrics year-on-year.“
Lemonade analyst ratings and price targets are at MarketBeat.