Cintas Corporation’s (NASDAQ: CTAS) Q4 results and guidance prove its parabolic share price movement can continue. The results continue a trend that includes organic and acquisitional growth, widening margins, robust cash flow, and capital returns. The trend has the stock price up more than 800% in the last decade, and another 800% is possible.
That’s why the company will split its shares this fall: the current high share prices and the potential for another triple-digit gain. Persistent business trends drive its share price, including healthy, resilient labor markets and an improving outlook for easing economic headwinds through lower interest rates. Investors looking to ride the Cintas wave can buy in now, wait to see if a dip forms after the split, and buy more later.
Cintas Has Mixed Quarter; Results Shine Where It Counts
Cintas had a mixed quarter regarding the analysts' estimates, but there is no bad news. The $2.47 billion in net revenue aligns with the consensus, a tepid result, but it is up 8.3% compared to next year, compounded by a wider margin and improved guidance. The organic growth, ex acquisitions, is 7.5%, driven by strength in both segments. The core uniform services segment advanced by 7.8%, led by a larger 9.5% increase in Other.
The margin is where the results shine brightest. The company reported a 150-basis-point improvement in the gross margin and a 120-basis-point gain in operating margin that drove accelerated growth on the bottom line. The improvements are due to reduced costs and expenses and were compounded by increased interest income. The net result is a 19.6% increase in income, a nearly 20% increase in GAAP EPS, and a cash-flow positive quarter.
Cash flow came in at $2.08 billion, sufficient to cover CAPEX and improve the balance sheet. FCF topped $1.5 billion, leaving ample money for acquisitions, dividends, and share repurchases. Balance sheet highlights include a 3x increase in the cash reserve, increased receivables, increased current and total assets, debt reduction, reduced liability, and an 11% increase in shareholder equity.
Because the cash position is robust and leverage ultra-low at 0.5x equity and 0.2x assets, the company is set up for another year of dividend growth and share repurchases. Share buybacks aren’t robust but offset dilution. The dividend is more substantial but near historic lows, yielding about 0.75%, with the stock trading at new highs. The salient detail is that Cintas increases the distribution annually, and recent increases have been double-digit, a trend that can be sustained.
The Sell-Side Tailwind Is Strong for Cintas
Cintas has an enviable business and sell-side support that provides a tailwind for the market. Analysts rate the stock at Moderate Buy and are raising their price targets. The consensus lags the price action by a few hundred basis points but is up 7% in the month before the Q2 release, 35% in the last 12 months, and expected to continue higher now. The recent revisions lead to the range's high end, suggesting another $40 or 5% is now possible. Institutions, which own 64% of the stock, have bought on balance for six consecutive quarters. Their activity spiked in Q1 2024 and remained bullish into the first month of Q3.
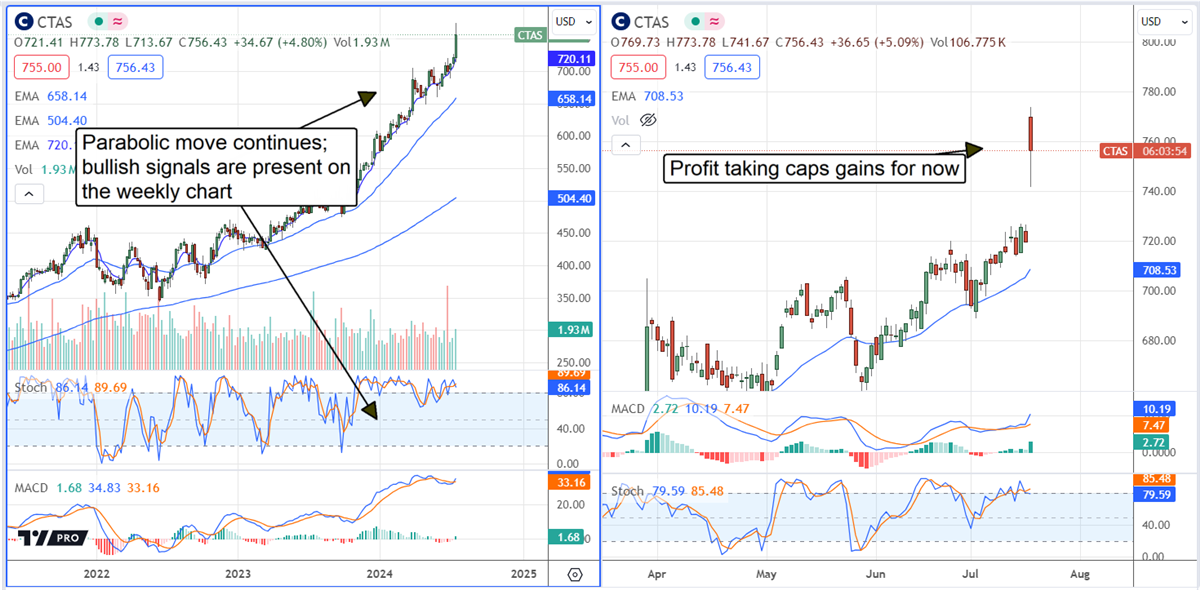
The Cintas' Technical Outlook: Bullish with a Chance of Correction
Cintas’ stock price surged more than 5% at the open following the Q2 release. The move put the market at a new high, but fresh highs may not come quickly. The market shows some signs of resistance and profit-taking at this level and may cap gains, allowing the market to consolidate and potentially close the gap that formed at the open. Assuming no change in the outlook, a move to retest support at or near $720 would be an attractive entry point and may trigger a rally.