Solaris Oilfield Infrastructure (NYSE: SOI) is up nearly 60% in July after announcing a deal to acquire Mobile Energy Rentals (MER). The move has the market on track to break critical resistance, likely leading to another large share price gain. The technical outlook is robust, suggesting a dynamic shift in sentiment that could have this market retesting its all-time highs within a few quarters.
Solaris Oilfield Infrastructure is a critical component of the US fracking industry. The company provides specialized equipment for oil and gas operators and is diversifying operations with the MER acquisition. The company provides proppant and related services vital to fracking and well deliverability. MER’s business is energy, which is a much-needed diversification from the consolidating fracking proppant industry. MER offers a range of power storage and delivery systems suitable to many businesses.
Solaris Oilfield Infrastructure Acquisition Is Worth the Money
Solaris Oilfield Infrastructure will pay MER $200 million in cash and stock, with most of the proceeds in stock. Stock will be paid to MER management and founders, who will transition to the SOI team. When the deal closes, Solaris Oilfield Infrastructure will change its name to Solaris Energy Infrastructure and begin trading under the symbol SEI. Financing is already secured, so the closing should be quick.
The critical detail for Solaris Oilfield Infrastructure investors is that MER is a high-margin business that will amplify bottom-line results. Solaris’ filings show MER's quarterly revenue was nearly $2.5 million for the first calendar quarter, which was about 4% of SOI’s last reported revenue, and most were profit. The net income margin was about 78% or $1.95 million, worth 27.8% of SOI’s take in Q1, and is enough reason to warrant the acquisition.
Solaris Oilfield Infrastructure Pays You To Own It
Among the highlights from Solaris Oilfield Infrastructure’s Q1 report are the cash flow and ability to pay dividends. The free cash flow margin was 20% or $14 million, allowing for $13 million in capital returns. The capital returns include dividends and share buybacks, which are steady and reliable. The company has paid a dividend since shortly after its 2018 IPO and increased it four times. The payout ratio runs near 60% of the earnings, which is sustainable given the balance sheet health and additional growth that may be expected. The distribution growth rate may even increase once the MER deal is closed.
Repurchases are central to the bull case in this stock. The company began buying back stock in Q1 of 2023 and has been aggressive. The $1.1 million repurchased in Q1 brings the cumulative total to 10% of the company’s share count, and there is still $15 million left under the current authorization. Because cash flow will improve when the MER deal closes, aggressive share repurchases will likely continue. Regarding the balance sheet, the company is well capitalized with more than $3.4 million on the books and low leverage, about 0.1x equity, and less than 0.5x assets.
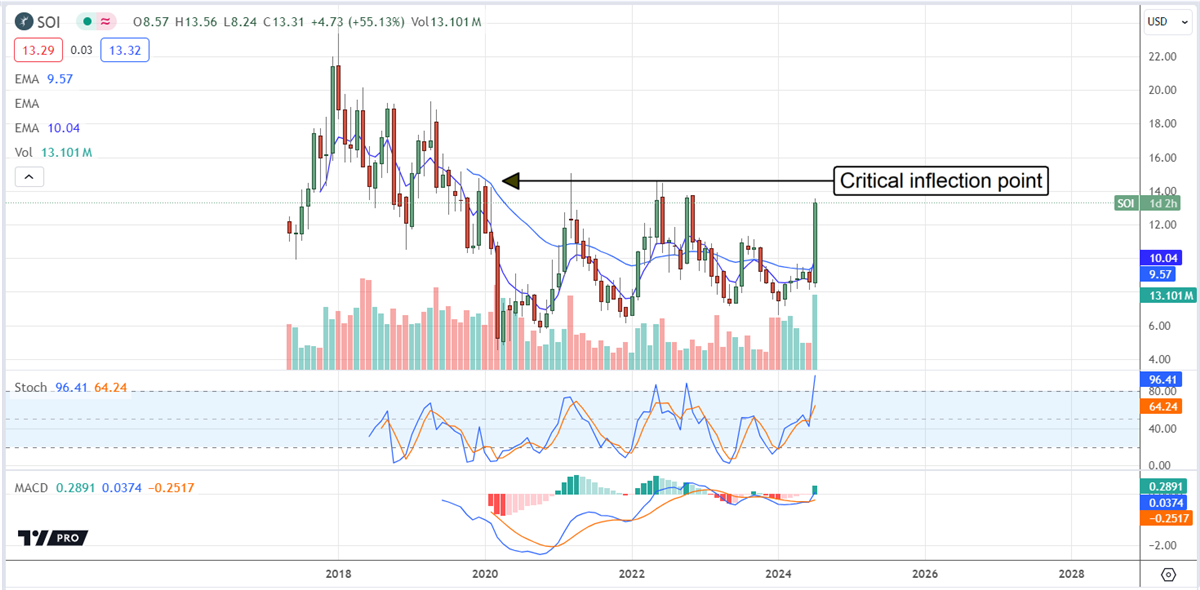
Solaris Oilfield Infrastructure Reaches an Inflection Point
The market for Solaris Oilfield Infrastructure is up for good reasons and may move significantly higher. The critical resistance point is near $13.75, the middle of the company’s historical trading range and an important inflection point for technical traders. A move above this level will open the door to a sustained and/or sharp rally that could take the market back to the range top. If the subsequent results are promising, assuming the MER deal closes, this stock could set a new high. In that scenario, shares of SOI could advance another $7. If $23.75 isn’t broken, this stock could remain range-bound at current levels indefinitely.