Applied Materials (NASDAQ: AMAT) stock price is rebounding now that the Q3 results are in. The report's takeaway is that outperformance in Q3 was compounded by better-than-feared guidance and shows strengthening in all end markets. Strength is driven by the push for AI, which has gripped global technology markets.
Applied Materials is ideally situated to continue capturing that strength because of its leadership position in semiconductor equipment and adjacent markets, including memory and display technology. The company’s position is strengthened because of the push to increase capacity globally while individual nations seek to re-shore their supply chains. This means that the recent correction is overdone for AMAT shareholders and investors, the stock valuation is very low, and a double-digit upside is the least to expect.
Analysts are Leading AMAT to a New All-Time High
The analysts' response to the news is mixed but aligns with the idea that this stock is undervalued. Marketbeat has tracked seven revisions from twenty-two analysts that peg the stock firmly at Moderate Buy and are raising the consensus price target. The revisions include three lowered targets offset by two increases and two reiterated targets; all are equal to the consensus or higher, which implies a 12% upside.
Because the bulk of the revisions, six of seven or about 85%, including the lowered targets, are above the consensus, investors should expect at least a 12% upside from current levels. Because five of the fresh targets, about 62.5%, are at $250 or higher, investors may expect to see this stock hit a fresh all-time high soon, possibly before the year’s end.
Applied Materials Advances on Strength in All End Markets
Applied Materials didn’t have a robust quarter, but the 5.4% top-line growth was 160 basis points above the consensus target. The strength was driven by gains in three of the four reported segments, with weakness only seen in Corporate. Corporate includes non-material business and is only 0.3% of the revenue, so it is immaterial to the outlook. Q3 revenue is a company record.
The remaining segments, including Semiconductor Systems, Services, and Display, grew by a mid-to-high single-digit amount. Semiconductor Systems, the largest segment, grew by 5.3%, with growth in each of the three sub-segments led by DRAM. The DRAM segment gained share, gaining 700 basis points for 24% of the segment total, indicating strength for memory makers, including Micron. The higher-margin Services segment grew by 790 bps, followed by a 680 bps gain for Display and Adjacent Markets.
Margin news is favorable to investors and the share price. The company reported wider gross and operating margins on a GAAP and adjusted basis, which drove leveraged gains for the bottom line. The critical detail is that adjusted earnings grew 12%, more than doubling the top-line advance, and provided robust operating cash flow. Cash flow came in at $2.39 billion, of which $1.19 or 50% was returned to shareholders.
Capital Return Helps Support Applied Material Stock Price
Applied Materials capital return includes dividend payments and share buybacks. Share buybacks approached $870 million in Q3, with roughly $331 million paid in dividends. The buybacks helped to reduce the count by 1.1% on average for the quarter and 1.3% YTD and are expected to continue. The dividend is worth about 0.75% in yield, a low amount offset by the distribution growth outlook. The dividend is less than 20% of the earnings, which leaves ample room for increases; the company has increased for seven consecutive years, and the pace of growth is accelerating, hitting a record 25% in 2024. Investors may expect a robust distribution CAGR to persist, but it will likely slow over the next few years.
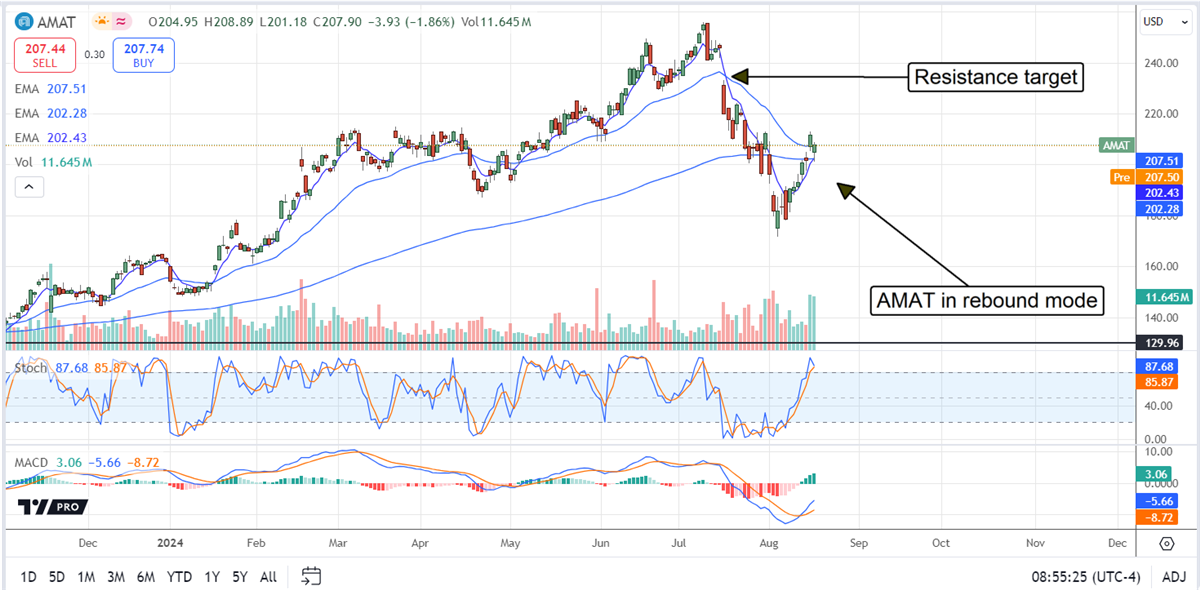
The price action in AMAT is bullish. The market advanced more than 5% following the release, confirming support at a cluster of critical moving averages. The price action slipped the following day but reconfirmed support at the cluster of moving averages, indicating a significant shift in market dynamics. Assuming support remains solid at the EMAs, this stock should continue to rebound and may reach the $220 to $230 level before September. The caution is that September is typically a problematic month for semiconductor stocks and may result in another pullback/buying opportunity.