Mediterranean fast-casual restaurant operator CAVA Group Inc. (NYSE: CAVA) shocked Wall Street with its stunning second-quarter 2024 earnings release. While the company beat consensus estimates by 4 cents, the real standout metric is the 14.4% YoY comparable sales growth (comps). This was unexpected, considering its previous quarter only showed a measly 2.4% YoY comps growth. The stock exploded higher by 20% following its earnings release. There's no doubt its 10.68% short interest added fuel to the fire as frenzied bears panicked for the exits in a proverbial burning theater.
CAVA Group operates in the consumer discretionary sector, competing with fast-casual restaurants like Chipotle Mexican Grill Inc. (NYSE: CMG), Sweetgreen Inc. (NYSE: SG), and Yum! Brands Inc. (NYSE: YUM).
Is CAVA the Next Chipotle?
Comparisons to Chipotle's meteoric rise abound once more. Both restaurants offer a garden-style, choose-your-toppings assembly line format where customers can customize salads, bowls, and pitas with their choice of meats, vegetables, sauces, and toppings. The build-your-own format of a locally sourced healthy Mediterranean menu resonates with health-conscious consumers. The nutritious and locally sourced factor gives it an edge over Chipotle.
Comparing CAVA, Chipotle and Sweetgreen
Investors were delighted when Sweetgreen posted 9% YoY comps, 21% YoY revenue growth, and a 200 bps improvement to 22.5% restaurant-level margins with an average unit volume (AUV) of $2.9 million. This was good enough to send shares higher by 30%. This was done across 225 restaurants.
Chipotle upped Sweetgreen by posting 11.1% YoY comps, 18.2% YoY revenue growth, 8.7% same-store transactions growth, and a 140 bps jump in restaurant-level margins to 28.9% YoY. Even more impressive is that it was done across 3,479 locations.
CAVA one-upped them all with its latest results, generating 14.4% YoY comps comprised of a 9.5% increase in guest traffic and a 4.9% increase in menu price and product mix. Restaurant-level profit margin improvement of 40 bps to 26.5%. AUV rose 385 bps to $2.7 million, up from $2.6 million.
Here’s Why Comparable Sales and Revenue Growth Differ
CAVA generated 35.2% YoY revenue growth due to the 78 net CAVA restaurants from the year-ago period. Comparable sales or same-store sales (SSS) rose 14.4% YoY. The difference between the two is how comparable sales or comps are calculated. Newly opened locations don’t affect comparable sales since it doesn’t include restaurants that haven’t been open for at least a year. Therefore, the revenues of the 78 new CAVA restaurants aren’t included in the comps but are included in the revenues. This makes comps a more credible metric when measuring restaurant sales growth.
Customization is Personalization
CAVA rotates its ingredients throughout the year to coincide with the season. Generally, you pick the base and add in the bards, proteins, veggies, toppings and dressing. Proteins range from grilled chicken, steak, lamb meatballs, salmon and falafel. Veggies can be selected from roasted red peppers, artichoke hearts, sundried tomatoes, sauteed peppers, roasted veggies, and shredded beets.
Its toppings and dressing comprise tomato, onion, and cabbage salad, diced cucumbers, pickled onion, tomato, and cucumber salad, feta, kalamata olives, and pickled onions. Dressings range from yogurt dill to lemon herb tahini, tzatziki, hummus, guacamole, baba ghanoush, harissa, tabbouleh, and pick de Gallo. In general, CAVA purports its 38 ingredients can be customized into 17 billion combinations.
Expanding the Brand in Grocery Stores Through Vertical Integration
CAVA produces its dips and salad dressing in-house through its two facilities. The company opened its new facility in Verona, Virginia, in addition to its 30,000-square-foot Laurel, Maryland facility. These facilities not only have the capacity to supply at least 750 CAVA restaurants but also produce its CAVA line of dips for grocery stores. The brand continues to grow and gain a loyal following of customers and shoppers. CAVA is still new and not recognized as a national brand yet, providing a long runway for growth.
Growing Its GM Talent Pool From Within
CAVA believes in hiring and promoting from within. Its Academy general manager (GM) network is a farming system that creates a pipeline of future GMs. CAVA plans to hire 75% of its GMs internally. Academy GMs are certified employees who train and develop new GMs. This way, CAVA grows its talent pool from within while providing upward mobility for its workers as an incentive. The goal is to place an Academy GM in each "garden," which is a cluster of eight CAVA restaurants. CAVA has also pumped up wages by 8% and health insurance benefits to keep its workers happy and incentivized, as they view these as investments, not expenses.
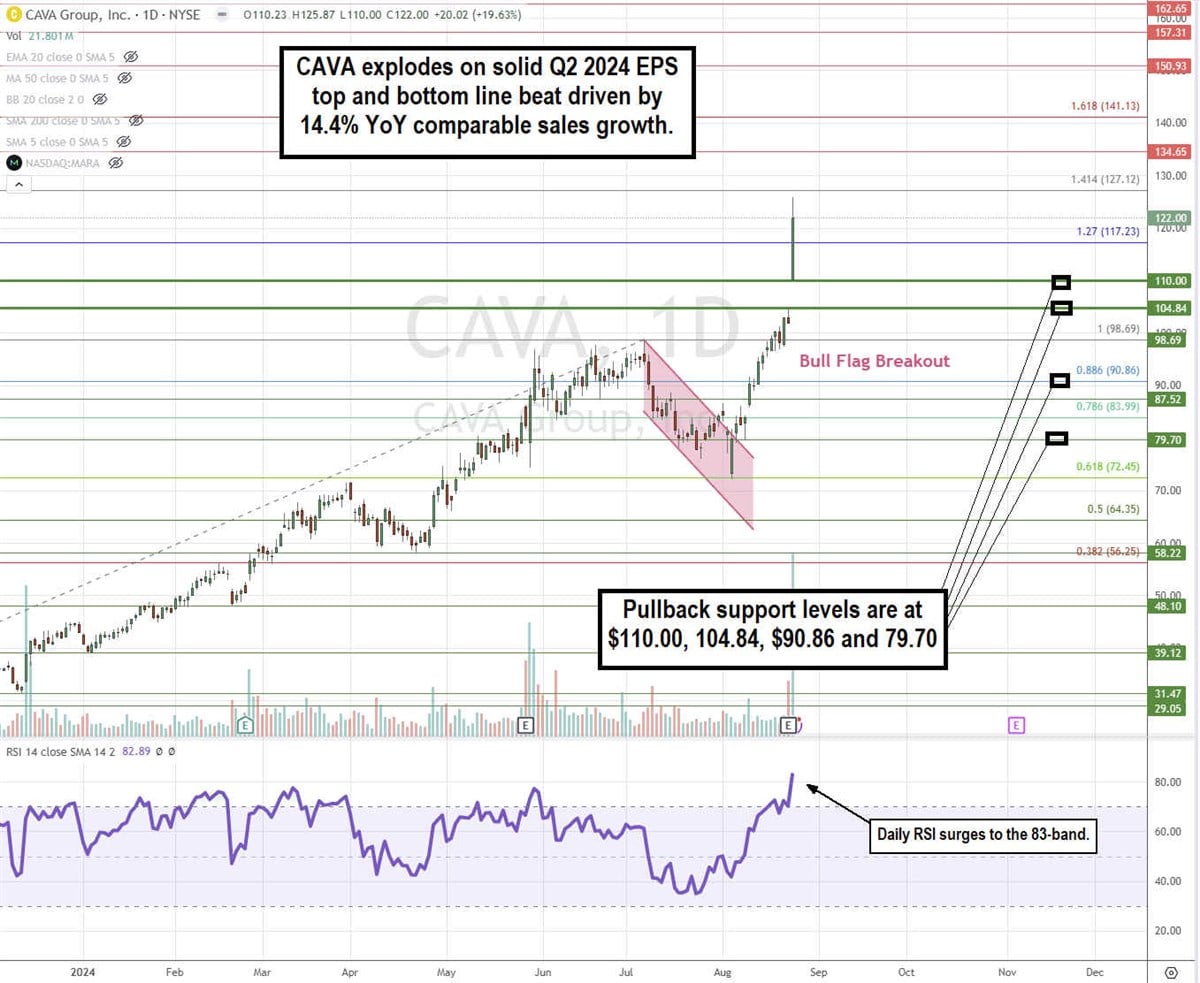
CAVA Triggers a Bull Flag Breakout Pattern
The daily candlestick chart for CAVA illustrates a bull flag breakout pattern. The flagpole formed on the rise from $31.47 to the $98.69 peak. The flag formed on the parallel descending upper and lower trendlines representing lower highs and lower lows. The bull flag breakout triggered the rise through the $79.70 upper trendline heading into its Q2 2024 earnings release. CAVA exploded higher on the initial gap to $110.00 to close at $122.00, up nearly 20% the following day. The daily relative strength index (RSI) surged to the 83-band. Pullback support levels are at $110.00, $104.84, $90.86, and $79.70.
Taking a Look at the Numbers
CAVA reported Q2 2204 EPS of 17 cents, beating consensus estimates by 4 cents. Revenues rose 35.1% YoY to $233.5 million, beating $219.47 million consensus estimates. Same restaurant sales rose 14.5%, driven by 9.5% traffic growth. CAVA opened 18 new restaurants in the quarter for a total of 341 restaurants, up 22% YoY. Restaurant-level profits rose 37.3% YoY to $61.3 million and 26.5% profit margin. Net income rose to $19.7 million, up from $6.5 million in the year-ago period.
CAVA Raises Guidance
CAVA raised its full-year 2025 adjusted EBITDA outlook to $109 million to $114 million, up from $100 million to $105 million in previous estimates. It also raised comp guidance to 8.5% to 9.5%, up from 4.5% to 6.5% in the previous outlook. It expects to open 54 to 57 new restaurants in 2024, up from previous estimates of 50 to 54 openings.
CAVA CEO and Co-Founder Brett Schulman commented, "Our results in the second quarter continued to demonstrate the strength of our category-defining brand and our unique and compelling value proposition.”
Schulman concluded, "During the quarter, traffic grew 9.5%, we opened 18 new restaurants and, driven by the power of our unit economic engine, generated an average unit volume of $2.7 million. In addition, we launched our new grilled steak main, once again exhibiting our excellence in culinary innovation. Grilled steak is significantly outperforming our expectations and giving guests another reason to visit CAVA and come back more often.”
With its stunning Q2 performance and strategic initiatives fueling growth, CAVA Group Inc. is solidifying its position as a formidable contender in the fast-casual dining sector, drawing favorable comparisons to industry giants.


