3M (NYSE: MMM) turned a corner this year, putting the bulk of its litigation risks behind it. While there are still headwinds and hurdles to cross, the path forward is clearer and is one investors will want to pursue. That path includes a return to top-line growth, improving margin, cash flow, and capital return.
The recent dividend cut is a mark against it, to be sure, but one that helped put the company in the position it is today. That is a position of improving financial health sufficient to ensure robust increases in capital returns over time. 3M was once a Dividend Aristocrat and King; it will be again. Until then, the new payment is worth more than 2%, trading at 18x earnings, a value, and a high yield compared to the S&P 500.
3M Grows Organically, Improves Balance Sheet in Q2
The critical details from the Q2 report are that the core business is growing, driving solid cash flows and aiding balance sheet improvements. Growth drivers include the accelerated launch of new products and improved execution at the customer level, driven by internal efficiencies and AI-generated insights.
The company’s reported revenue was down due to the impact of legacy business but offset by organic growth in the ongoing segments. Growth in core segments is expected to persist through the year’s end and accelerate in 2025, aided by easing economic conditions related to FOMC interest rate cuts. Margin news was more impressive, with adjusted EPS up 39% and sufficient to sustain financial health, with margin improvement expected to stick.
The balance sheet highlights include a doubling of cash, a 50% increase in cash and equivalents, and reduced debt. Debt was down 10% year over year at the end of the quarter and will continue to fall as the quarters progress. Total assets and equity are down, but no red flags have been raised because of Solventum's spinoff earlier in the year. Factoring that out of the equation, total assets and shareholder equity are rising.
Analysts Lower Estimates but Lift Targets for 3M Stock
Analysts have lowered the bar for 3M’s Q3 results but have been raising their estimates for the stock price. The Q2 results mark a change in sentiment that shifted from down to up and provides support for share prices. The consensus target lags the stock price but is led higher by the revision, most of which have 3M trading in the range of $133 to $150 or flat to up 15% at the range’s high end. Investors can expect to see this trend continue following the Q3 results.
The most recent analyst update is from BMO Capital. The firm screened for high-quality names that can withstand market volatility. The screen included criteria such as investment-quality debt ratings, growth volatility below the S&P 500 (NYSEARCA: SPY) average, and return on equity and available cash above average.
3M’s next earnings release is due in late October and will likely impress the market. Despite the strengths shown in Q3, the analysts have lowered the bar considerably and expect revenue to be flat to down sequentially on an ongoing basis.
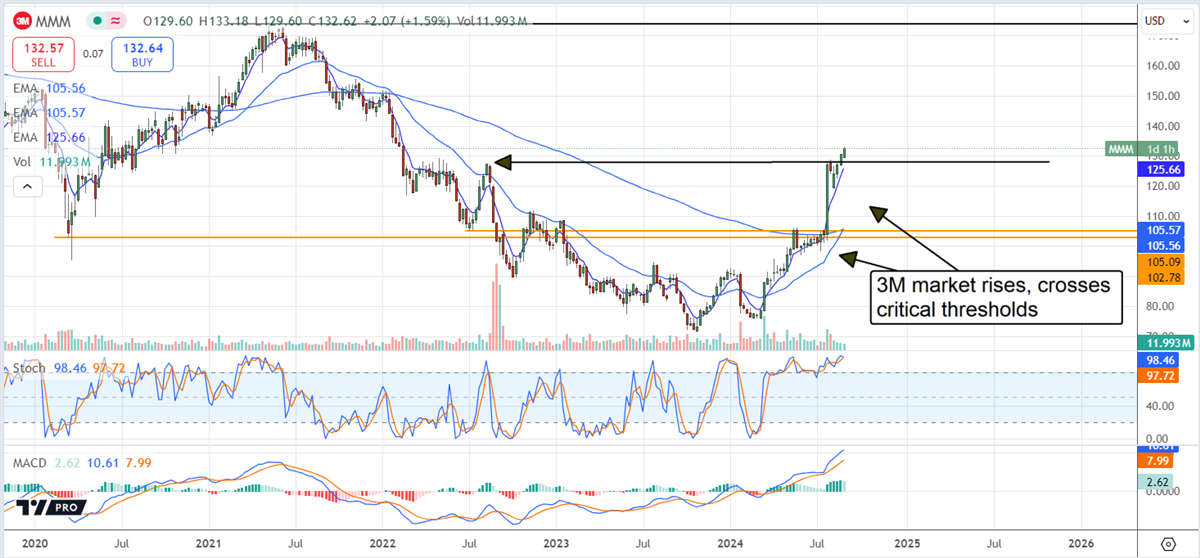
3M Stock Is in a Technical Reversal, Can Climb 30% Within a Year
3M’s stock price is in a technical reversal that could add another 30% to its price over the next year. The market shows a solid bottom at the $72.50 level with critical breakouts near $105 and $130. Those breakouts confirm a technical Head & Shoulders market reversal and bring targets of +25% and +80% from the $130 level into play. Those targets are derived by projecting the magnitude of the pattern to the break-out point, creating a range bracketing the 2021 highs. The 2021 highs are a likely target, potentially reached by late 2025, and a 30% gain when reached.