The reading of August CPI data led the market to sell off because it was as expected. As much hope as there was for aggressive interest rate cuts this year, the FOMC would unlikely follow through on them because underlying economic data remains solid, and deep in the market’s heart, it knows it to be true.
The labor data has weakened from very robust levels but is still healthy, with jobs growing, wages rising, consumers still spending, and inflation falling slowly toward the target rate. We are on track for rate cuts, but not aggressive ones, because lowering rates too quickly will accelerate inflation.
However, rate cuts are the operative factor because they mean a shift in economic policy that should ease economic headwinds. A soft landing is still in play, but there is little chance the FOMC will risk another acceleration in inflation by cutting rates aggressively without clear signals a recession is coming. The takeaway is that a soft economic landing is still in play, which means a sector rotation and increased volatility for the market today.
Goldilocks CPI Data Points to Soft Economic Landing
The CPI data is Goldilocks quality, not too hot or too cool, showing a slow, steady trend in inflation that is heading to the 2% target rate. The headline figure was a little cooler than the expected 2.6% but not enough to raise fear of a recession and offset by a steady, as-expected core figure.
The core CPI held steady at 3.2% for the second month, aligning with a plateau in the PCE index, but should start to recede soon, leaving the soft-economic landing in play.
Energy is an underpinning factor in consumer-level inflation, and oil prices are falling because recent demand forecast reductions from significant producers and analysts have undercut the market. Among the causes is the declining use of gasoline in China related to EVs, a trend that is unexpected to end, only to strengthen globally.
Even without new lows for oil, fuel costs are declining, as evidenced by the 0.8% monthly and 4.0% YOY decline in the CPI’s energy component. It suggests that energy-based deflation is already underway; the FOMC will become more aggressive if that gains momentum.
Soft Landing, Sector Rotation, and the Market Sell-Off
The CPI data aligns with a long, slow reduction in FOMC interest rate policy and a shift in economic fundamentals expected to reduce headwinds for businesses and consumers. The net result should be broadening economic strength as businesses find it easier and cheaper to get credit and consumers' strength improves. That means improving business for a wider range of companies and a broadening stock market rally, hence the need for a sector rotation today.
The heavily concentrated S&P 500 is unwinding the last two years of rallying driven by higher-for-longer economic policy, stimulus spending, and the rise of AI. It could continue to move lower for weeks before finding a bottom and rebounding significantly, possibly longer because it will be months before the FOMC policy changes begin to impact consumers.
The S&P 500 is Set to Fall as Fear Rises
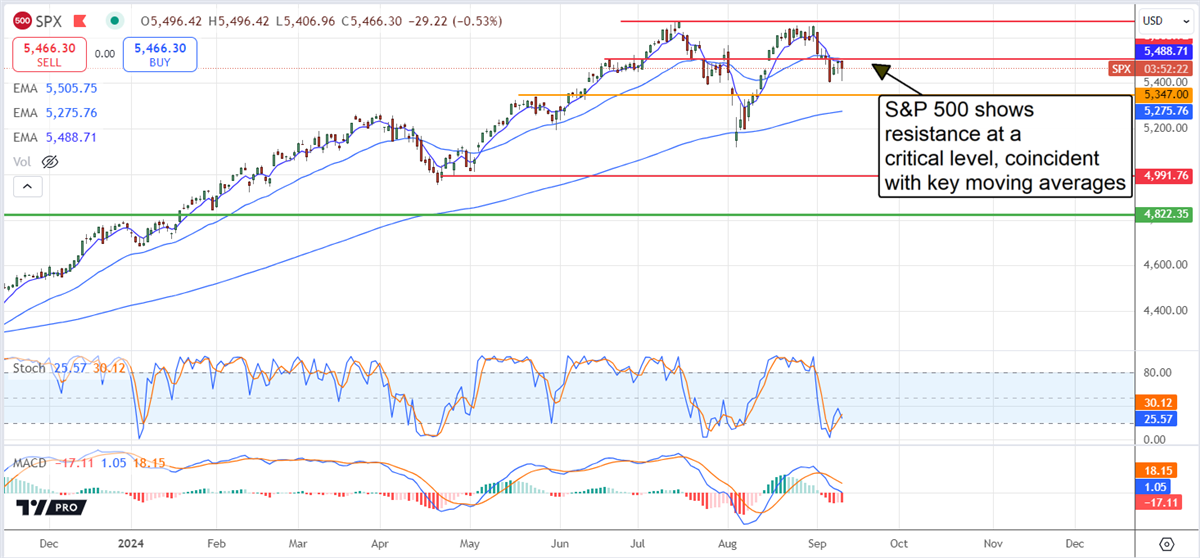
The S&P 500 (NYSEARCA: SPY) fell more than 1.0% on the news as selling gained momentum. The move showed some signs of support at the prior week's lows, which have yet to be broken, but the stronger signal is to the downside. The move created a red candle, confirming resistance at a critical level that coincides with a cluster of moving averages. The cluster includes an ultra-short 9-day EMA and a short-term 30-day EMA, pointing to significant resistance at the 5,500 level, made stronger because this is the second signal in two weeks.
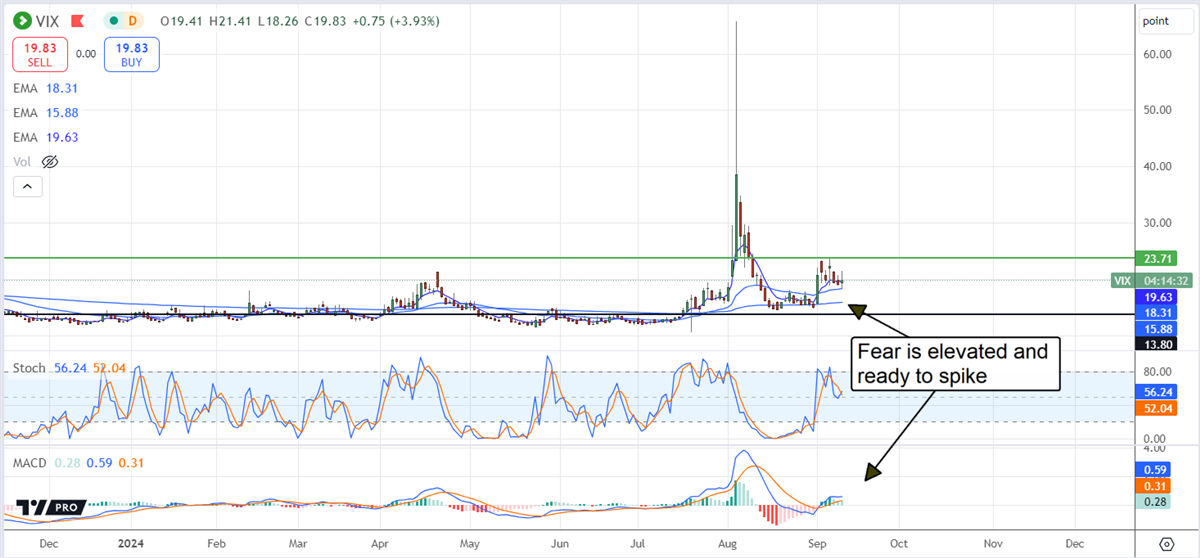
The VIX (CBOE: VIX) is equally bearish, showing elevated fear levels and a market ready to run for the exits following years of fearlessness. The rush to exits could happen as soon as the FOMC releases its policy statement in mid-September because the market continues to price in an aggressive pace of cuts. The CME FedWatch Tool still shows a high expectation for four twenty-five basis point cuts by December.