
While footwear manufacturers like Nike Inc. (NYSE: NKE), Crocs Inc. (NASDAQ: CROX), and Skechers U.S.A. Inc. (NYSE: SKX) stocks took hits with contracting sales due to weaker consumer spending, ON Holdings AG (NYSE: ONON) has been quietly making new highs trading up nearly 90% year-to-date (YTD). This consumer discretionary sector company’s sneakers have an elastic demand appeal with runners.
On Holding’s CloudTec Technology
From Deckers Outdoor Co. (NYSE: DECK) Hoka's "Active Foot Frame" and "MetaRocker" technology to Nike's "Tensil Air" and "ReactX" technology with carbon fiber plates and ZoomX foam, it seems every sneaker manufacturer has some proprietary technology that makes their shoes special.
On Holding's CloudTec technology is meant to make runners feel like they're walking on clouds. It's a Swiss-engineered cushioning technology comprised of cylindrical cloud parts located on the shoe's outsole that compress vertically and horizontally to absorb impact, providing a soft landing with each step.
It also has a rebounding effect that builds a propulsive force to propel the runner forward. It converts the kinetic energy generated by each landing into a powerful takeoff.
Unveiling LightSpray Technology
On Holding unveiled its LightSpray technology during the 2024 Paris Olympics. It's a revolutionary manufacturing process that takes three minutes to make each shoe. They are spray-on shoes. It uses a robotic arm that applies liquid polymer material onto an upper shoe mold, instantly solidifying on contact and creating a completely customized upper weight of only 30 grams with 75% less carbon emission. The technology eliminates seams, laces, tongue, and heel caps to improve comfort, reduce irritation, and create a shoe that weighs virtually nothing. Hellen Obiri wore LightSpray On shoes to win her second Boston Marathon in 2024.
Not Inventory Glut, But Inventory Shortage
Apparently, runners can’t get enough, as On Holding has had to deal with inventory shortages, not inventory surpluses and glutes experienced by competitors. This also keeps On Holding’s merchandise selling at full price, from $140 to $190 per pair of shoes, with very few promotions, which contributes to its margins.
Double-Digit Sales Growth in All Channels
On Holding reported its second quarter 2024 EPS of 16 cents, missing analyst estimates by 1 penny. Gross profit margin rose 40 bps to a hefty 59.95%, driven by full-price sales and lower freight costs. Revenue climbed an impressive 27.8% YoY to 635.2 million, beating analyst estimates of $628.52 million. Sales rose double-digits across all channels. Direct-to-consumer (DTC) sales rose 28.1% YoY. Wholesale revenue rose 27.6% YoY. Sales for the Americas rose 26.7% YoY. Asia Pacific sales rose 24.8% YoY.
Reiterating Double-Digit Guidance
On Holding reiterates its full-year expectations of at least 30% YoY net sales growth, 60% gross operating profit margin, and an adjusted EBITDA margin of 16% to 16.5% in constant currency. The focus will be on On's U.S. warehouse automation to scale its distribution capabilities in the United States to meet the outsized demand.
On Holding CEO and Co-Founder David Allemann commented, “As mentioned, the strong brand momentum converts into strong demand for On across all our channels and partners. The ability to convert this momentum to sales, especially in the Americas region, would have been even higher. Still, the ongoing transition of our Atlanta warehouse led to some product availability constraints, including key franchises like the Cloud and delayed or missing deliveries both toward our D2C and wholesale customers.”
ONON Stock Sets Up an Ascending Triangle
An ascending triangle is a bullish pattern comprised of a flat-top upper trendline resistance converging with an ascending lower trendline support at the apex point. The breakout occurs when the stock surges through the upper trendline resistance.
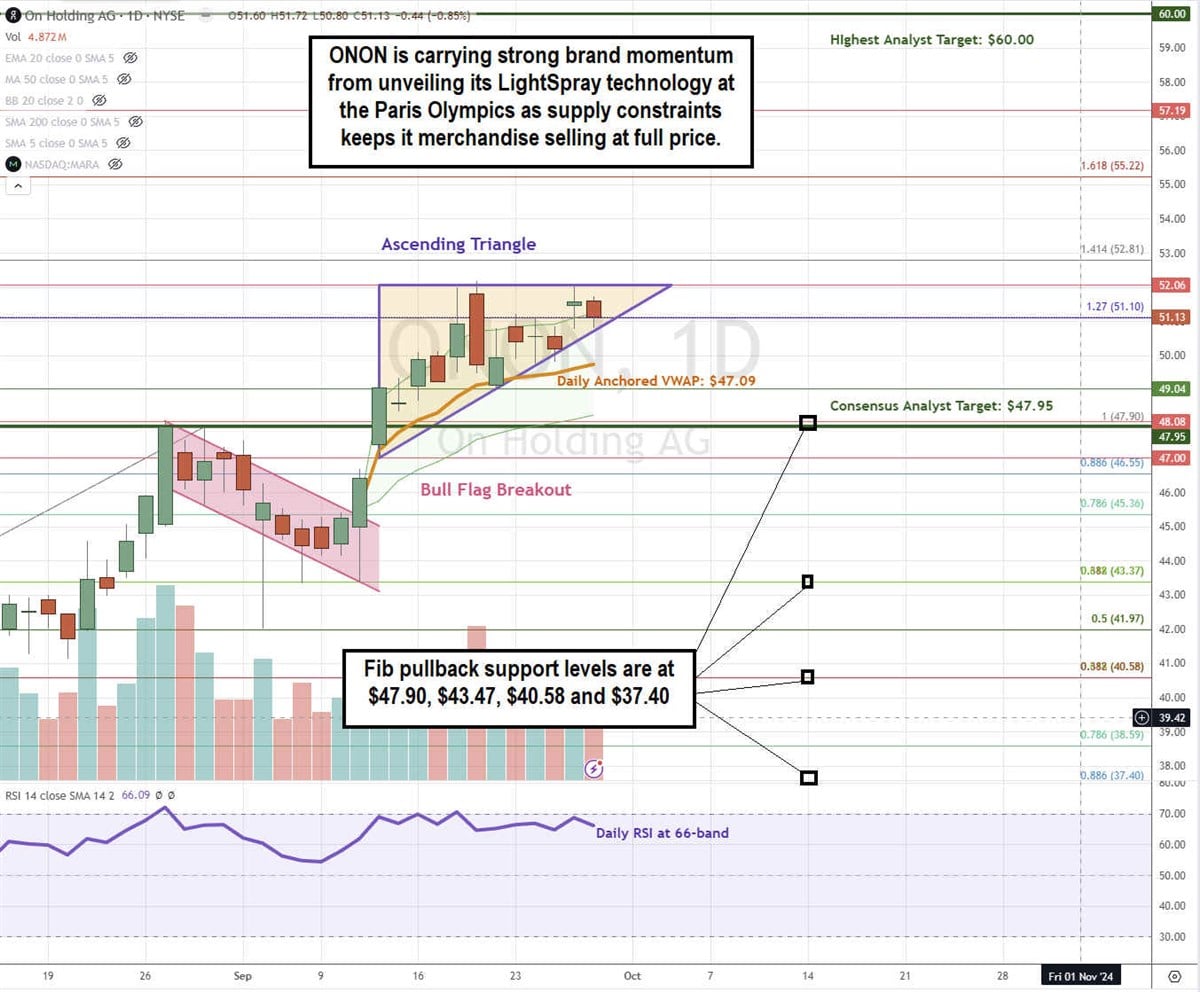
ONON formed a flat-top upper trendline resistance at $52.06. The rising lower trendline support formed from higher lows on pullbacks. The ascending triangle breakout triggers above $52.06. The daily anchored VWAP support is at $47.09. The daily relative strength index (RSI) is flat around the 66-band. Fibonacci (Fib) pullback support levels are at $47.90, $43.47, $40.58, and $37.50.
On Holding’s average consensus price target is $47.95, and its highest analyst price target is $60.00. Analysts have given it 18 Buy ratings and five Hold ratings.
Actionable Options Strategies: Bullish investors can buy on pullbacks using cash-secured puts at the fib pullback support levels to buy the dip and write covered calls to execute a wheel strategy for income.
Bullish options investors can take a bullish call debit spread for less capital than owning the stock while minimizing the downside with capped upside gains.


