
TJX Companies (NYSE: TJX) is a top-shelf blue-chip quality dividend growth stock on par with Cintas (NASDAQ: CTAS), Casey’s General Stores (NASDAQ: CASY), and Kroger (NYSE: KR).
Its market position within a staple retail consumer category, growth, cash flow, balance sheet, and capital return quality are reflected in its stock price, which has steadily risen for decades and is on track to sustain the parabolic increase over time.
The company’s resilience in various economic conditions further strengthens its appeal as a long-term investment.
This is a look at why it's a good buy for investors in 2025.
TJX Companies to Increase Its Capital Return in 2025
The Q4 F2025/C2024 earnings release and F2026 guidance highlight plans to increase the capital return, a tailwind for stock prices. The company announced a 13% distribution increase, expanding the streak of annual increases to four following the COVID-related suspension, and buybacks will also be significant.
[content-module:DividendStats|NYSE: TJX]The forecast is for $2.0 to $2.5 billion in share repurchases, steady compared to 2024 and equal to 1.6% of the early March market cap. The net impact of buybacks in calendar 2024 reduced the share count by 1.46%, and a similar result is expected in calendar 2025 and each subsequent year.
TJX Companies' dividend yield aligns with the S&P 500 average in early 2025. Still, its outlook for sustained, double-digit distribution growth is more robust, supporting an outlook for higher share prices over time. The company’s payout ratio is less than 40% of GAAP earnings, and the cash flow is solid, leaving ample room for distribution increases at an above-average pace.
The company’s F2025 balance sheet highlights also point to higher share prices over time. The highlights include reduced cash offset by increased receivables, inventory, current and total assets. Current and total liabilities are also up but insufficient to offset the asset gains, leaving equity up by 15%. That is a significant gain considering the impact of share repurchases and the 15% increase posted in the prior year; a similar gain is expected in 2025.
Sell-Side Interest Provides a Strong Tailwind for TJX Companies
The sell-side interest in TJX Companies is telling and provides a strong tailwind for the market. Analysts rate the stock at a consensus of Moderate Buy, are lifting price targets following the F2026 guidance, and see the stock advancing 10% from early March levels to set a new all-time high. The most recent targets put this market in the high-end range, another 10% upside.
Institutional activity is equally strong, with them owning more than 90% of the stock and the balance of activity shifting significantly in Q1 of this year. Institutions that had sold on balance in Q4 2024 reverted to buying in Q1 2025 and ramped the buying activity to a multiyear high, netting nearly 2% of the stock.
The long-term outlook for TJX is also solid. The company’s position as the leading off-price retailer has it set up to sustain a mid-single-digit top-line growth pace through the middle of the next decade. The company is also expected to improve its operating leverage and deliver a higher single-digit earnings growth pace. Earnings are expected to top $9.50 by 2034, putting the forward valuation near 12x earnings, making it a deep-value opportunity.
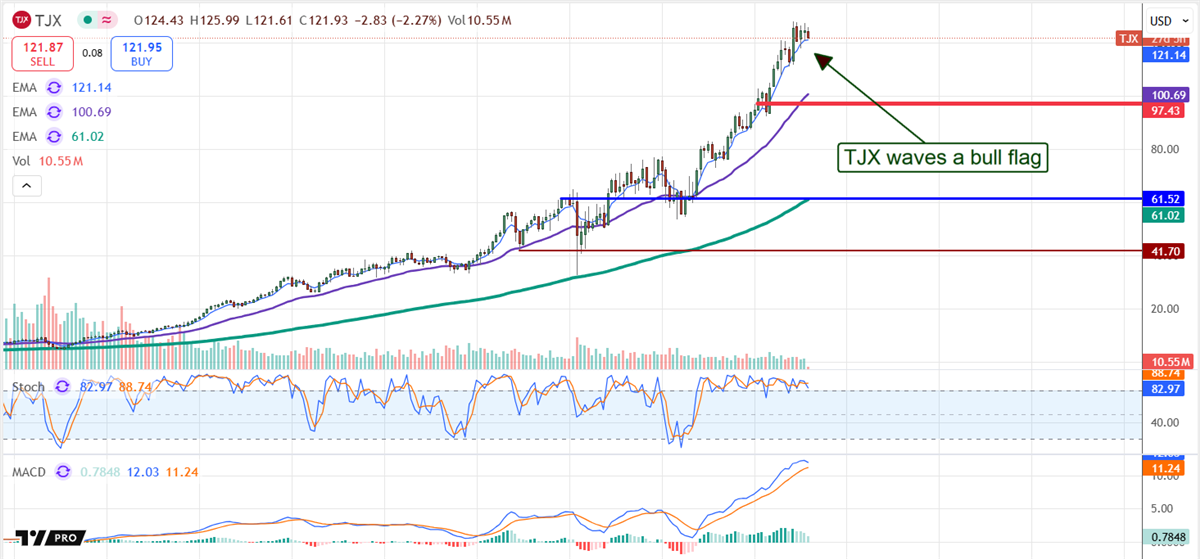
TJX Market Winds Up for Next Big Movement
The price action in TJX stock fell following the Q4 results but is not indicated to fall far. The long-term outlook, as indicated by the monthly price action, is far more bullish, including a Bullish Flag Pattern. The Bullish Flag Pattern is a sign of bullish activity potentially leading to the continuation of underlying trends. In this case, the market is up 10% in the near term, 25% in the mid-term, and 100% in the longer term, providing robust targets for 2025. Moving to new highs would indicate trend continuation and bring targets of +10%, +25%, and +100% into play.
Where Should You Invest $1,000 Right Now?
Before you make your next trade, you'll want to hear this.
MarketBeat keeps track of Wall Street's top-rated and best performing research analysts and the stocks they recommend to their clients on a daily basis.
Our team has identified the five stocks that top analysts are quietly whispering to their clients to buy now before the broader market catches on... and none of the big name stocks were on the list.
They believe these five stocks are the five best companies for investors to buy now...


